R algorithm integration with Statistical Manager
Hypothesis and Thesis
This experiment is performed by FAO in order to test and assess how data managers / developers can plug easily algorithms (especially R algorithms) in the infrastructure, through the Statistical Manager tool, and respond quickly to data analysis needs while benefiting of iMarine computing resources.
The product of this experiment is a basic service that allows to convert a SDMX dataset, provided through a SDMX service URL, to the CSV format. Other similar experiments will handle more complex algorithms, and will complete the outcomes of this first basic experiment
The scope of these algorithm integration experiments is:
- developer/algorithm integrator oriented
- to assess how a data manager / developer can plug an algorithm by their own,
- to identify potential improvements for the ease, speed and sustainability of the R algorithm integration procedure
- end-user oriented
- to assess user friendliness of the Statistical Manager data analysis tool
Outcome
The results of this experiment show that the procedure of integrating R scripts as data analysis algorithms is a quick, straightforward and sustainable to be considered by institutions that wish to plug data analysis algorithms.
From a developer/algorithm integrator point of view, the benefits are the following:
- The e-infrastructure, by means of the Statistical Manager, provides a fast, straightforward, and sustainable procedure of algorithm integration, highlightly recommended for institutions
- In term of software tools & programming language, some basic knowledge is required:
- very basic knowledge in Java programming is required: The Statistical Manager is Java-based. Each algorithm has to be handled in a Java class and implement a generic algorithm interface. However, the Statistical Manager is designed in such way the implementation is very straighforward and familiaring with it is very quick
- knowledge of an IDE (e.g. Eclipse) and SVN is recommended
- Additional knowledge of Maven is recommended. However, this one is optional, and required only if data managers intend to build a separate Java project to deliver the algorithms (as done in this exercice).
- Through this procedure, the e-infrastructure offers a powerful tool to institutions, especially research institutions, to expose R scripts (often scattered among offices & laboratories) to be exposed as web-services, and make benefits of the e-infrastructure computing resources
From a user point of view, the benefits are the following:
- The algorithms are exposed in a rich and ergonomic web interface, where the user can access 3 components: (i) a dataspace, where he can upload his data, (2) an environment to execute the algorithms he wants, and (3) a place where he can check the computations.
- The tool allows non-R users to execute an R script in a user-friendly way
- The tool allows the usesr to access to the history of computations performed by him, the computation characteristics (status complete/failed, ellapsed time, etc), and offers the possibility to relaunch a computation
- In addition, each computation performed by the user comes with set of meta information
Activity Workflow
- The activity was done by familiarizing with the Statistical Manager, relying both on the documentation and a tutorial video made available to facilitate the integration of algorithms.
- A basic R script was created to test the Statistical Manager. This script allows to convert a SDMX-ML dataset to CSV.
- In order to integrate the R script, a separate Java Maven project was created (with the aim to add further algorithm later).
- Few exchange with the Statistical Managers developers was required for the project settings, an highlighted some few scatter in the documentation
- The R script was integrated in the project, tested and sent to Statistical Manager team for its deployment
- Additional exchange with the team took place, to have some clarifications on:
- algorithms inputs (difference between a File input and remote resource - URL - input)
- the need for data managers to indicate the eventual R package dependencies to install prior to the algorithm deployment
- how to add the algorithm within a given category of algorithms (for display purpose in the Statistical Manager user interface)
- The algorithm was successfully deployed and is currently operational in the development portal, and usable in the rich user interface of the Statistical Manager.
Conclusion
While the outcomes of this first experiment are very positive and encouraging, additional experiments will be performed by FAO to further test the Statistical Framework. The following lists some aspects worth assessing on the R algorithm integration:
From a developer / algorithm integration point of view:
- algorithm integration with multiple inputs, and outputs
- use of control terms inputs (enumerations / combo boxes)
- dynamic inputs & forms (e.g. select a type of input File/Remote resource, and display of appropriate input from file browser / url string input)
- algorithm exposition as OGC Web Process (OGC WPS specification), for assessing external use
From a user point of view
- exploitability of algorithms in target domain applications of the iMarine e-infrastructure such as the Tabular Data Manager, or GeoExplorer
Recommendations & future developments
Developer/Algorithm integrator recommendations & potential developments
About the integration procedure
- In case of building a separate Maven for handling a set of algorithms:
- the R script is not part of the archives produced and sent to the Statistical Manager team. A proposal would be to suggest to development team an improvement of the Maven pom.xml in order to include the R script(s) in the archives. Indeed, it is not clear how a standalone library of algorithms is deployed by the development team in the overall Statistical Manager.
- related to this, would it be possible to improve the structuration of the project model (e.g. handle R scripts in a dedicated directory, separated from other properties file)
- need to clarify if properties files not relevant for the library of algorithms developed by an institution can be made empty? or deleted?
- the capacity for a algorithm integrator to deploy
About the Statistical Framework
- evaluate the possibilities of abstraction from Java programming, which despite the simple Java class to be developed, may constitute an important barrier for end users, and a non-negligible cost for institutions. Existing technologies (e.g. WPS 52°North mechanism to read R annotations) could be valuable.
- Limit the role of properties file to discovery of Java algorithm class by the overall application
- Add the possibility to specify the algorithm title in the Java class / or R script(as it's for the abstract/description)
- Add the possibility to add keywords to describe an algorithm (also in the Java class / R script)
- investigate how to enable a versioning system (ie. capacity to deploy another version of the algorithm while keeping the previous one, capacity to have a change history for the algorithms, and execute an versioned algorithm, even if it's not the latest)
About the documentation
- The documentation wiki page relates to another wiki page related to integration of Maven components, and introduces some confusion. It would be useful to distinguish the 2 possible ways how to integrate the algorithm:
- in the existing Java projects (that can be checked-out through SVN)
- link this tutorial to documentation how to create easily a gCube component. A video would be useful on how to to create a simple gCube maven component
- Generally related to the wiki that has to be consulted: while the wiki pages consulted (see above) are well done, some pages are quite similar by their title, and this make people lost, eg:
- Section “Test the algorithm”: It would be good to introduce an example using basic Junit tests rather a Java main method
- The documentation needs to add a note on the perspectives and how a user could choose its categorization of algorithms
User oriented recommendations & potential developments
- Possible improvements of the Statistical Manager web-interface
- In the list of algorithms, mprove tthe filtering functionality. Now seems to target the process name. It would be good if it could be extended at least to the abstract (would enrich the processes discovery) & the category of processings
- In the computation viewer: Structuring the different sections ("Computation details", "Parameters", "Operator details") in tabs would be valuable
- in a broader scope (beyond the Statistical Manager), it would be interesting to discuss how inputing remote resources (url) could be improved. At now, a remote resource is handled by a string, hence a user has to provide this string, which could be very blocking especially when this string corresponds to a service request (e.g. SDMX GetData, WFSWeb Feature Service GetFeature). In order to execute properly an algorithm, a user might need to browser across the data, apply filters, hence delegating the preparation of URL to a "data browser" application. Related to this, it's crucial to be aware that, despite the i-Marine e-infrastructure is offering a wide range of applications, often inter-connectable, some institutions might be interested in using only one part of the flow. Hence, an institution that wants to exploit the Statistical Manager, but not the Tabular Manager, might need an ease access to datasources, especially remote.
Experimentation
- The basic R script enabling the SDMX-ML to CSV conversion was integrated with a basic SDMXDataConverter Java class writen in a separate Java Maven project named statistical-manager-figis algorithms. Junit tests were performed for quality assurance.
- Source code is available here. This source code can also be used as example for institutions that need to familiarize with the Statistical Manager.
- The algorithm was deployed by Statistical Manager team and tested with the user web-interface:
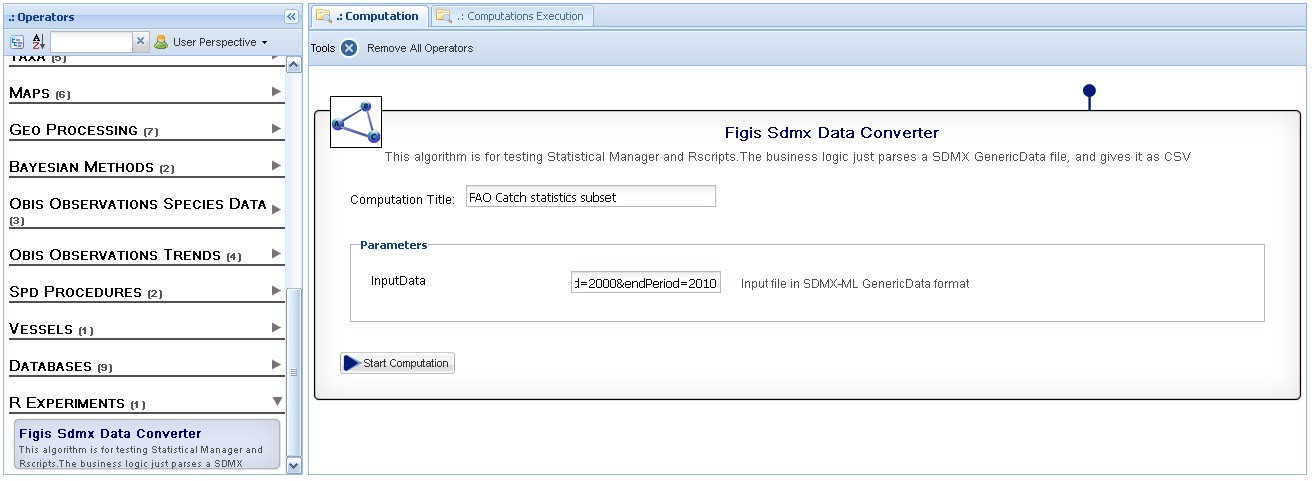
1- View of the Statistical Manager execution component: the left panel highlights the new algorithm added under "R experiments", the central panel shows the input form for the new web-service, with a SDMX-ML GetData request example
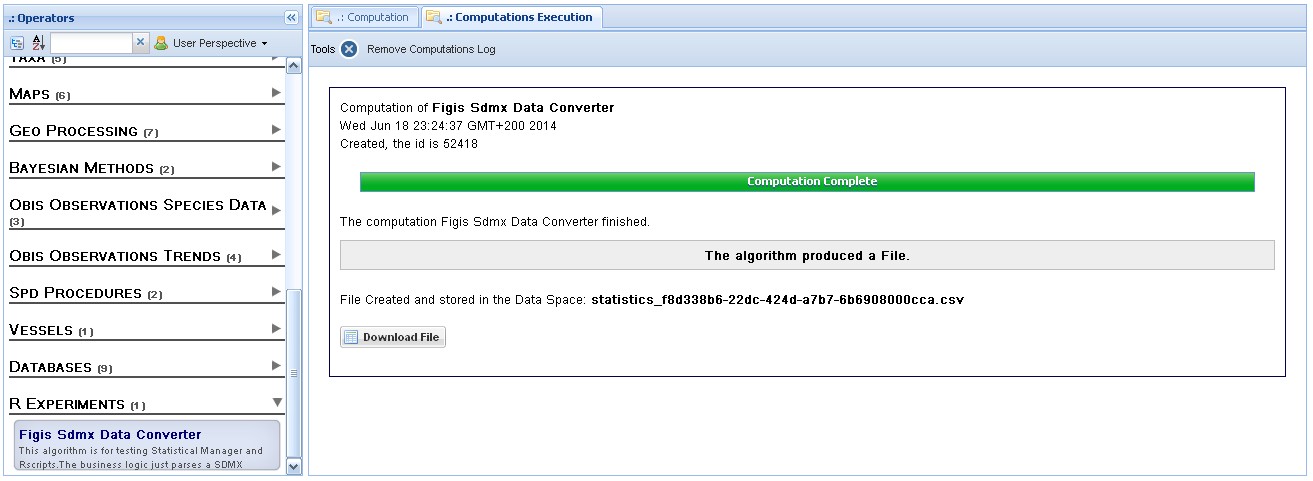
2- View of the computation status once executed, where the output CSV file can be downloaded by the user
3- View of "Check computations" panel, where the user can access to the history of computations he performed
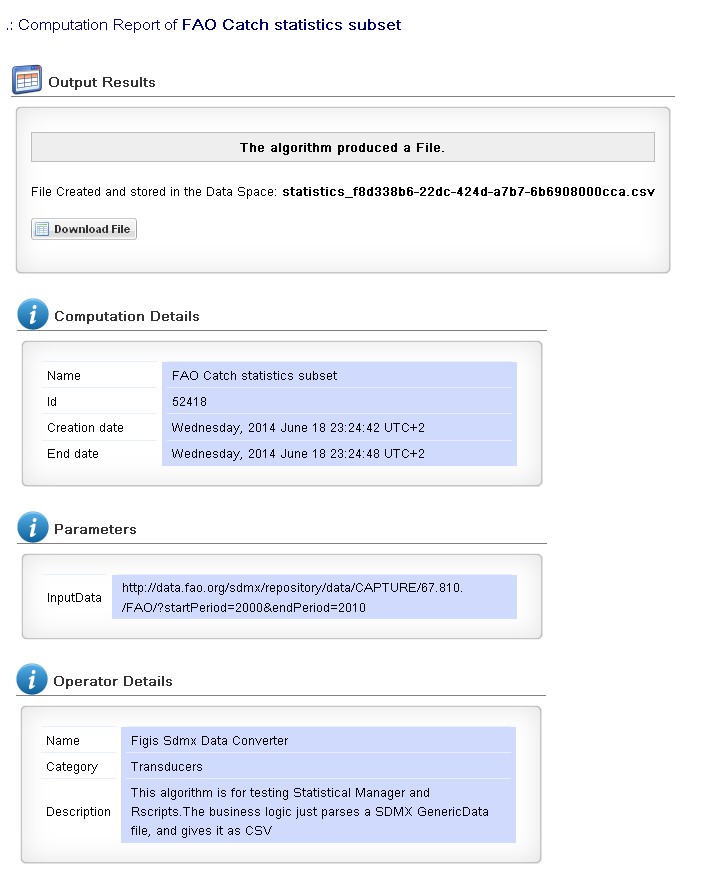
4- View on the Meta information appended with the algorithm computation
Related links
- How to implement algorithms for the Statistical Manager
- Implement Statistical Manager algorithms - tutorial video
- rsdmx package for R used for the SDMX-ML Data converter


