IOTC Area Predictive analysis
Description
The Indian Ocean Tuna Commission (IOTC) is an intergovernmental organization that coordinates the regulation and management of tuna in the Indian Ocean. The commission publishes data about fishing activity to be used by fishery managers to monitor catch effort and exploitation.
The experiment described in this page, focuses on the Purse Seine fishing activity, which is a very efficient way of catching fish and can produce large amounts of revenue in a short period of time. On the other side, this kind of fishing practice can also cause damage in a very short time. Unregulated purse seine activity would result in non-sustainable fisheries resources. Purse seining, in fact, is a non-selective fishing method that captures everything that it surrounds, including protected species. Examples are sea turtles, which can be captured by a purse seine or marine mammals that can be captured by catch.
Thus, monitoring and regulating purse seining is important and the example in this page shows an analysis to detect, monitoring and reduce such activity.
Hypothesis and Thesis
Outcome
Starting from the reports for Purse Seine fishing activity in the Indian Ocean from 1997 to 2012 we detected:
* an overall periodic, yet decreasing, number of Purse Seine fishing hours in the Indian Ocean;
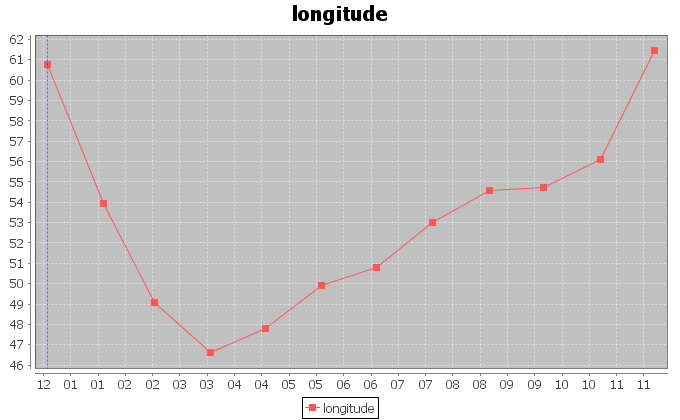
* a periodic trend in the visitation of fishing locations, with periodicity between 56 and 46 months;
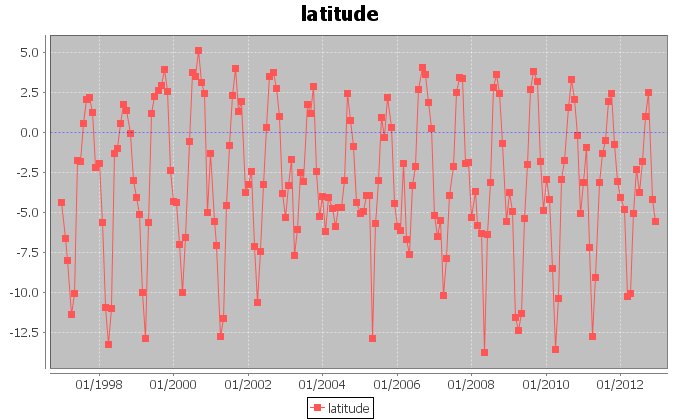
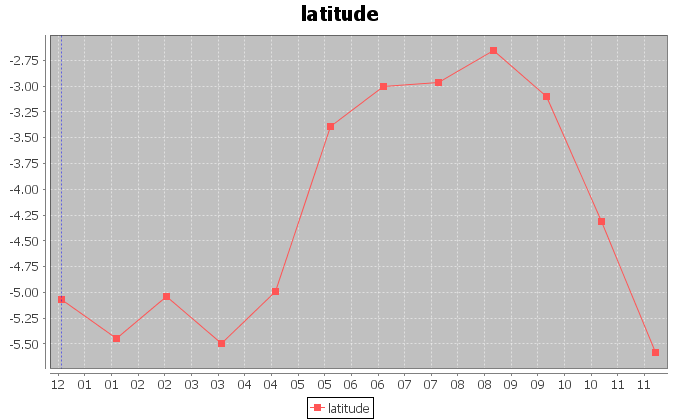
* an overall periodic variation of 12 months in the latitudes of the Purse Seine activity;
* forecasted locations for the fishing areas in the next years;
* a list of the most exploited areas at 10 degrees resolution;
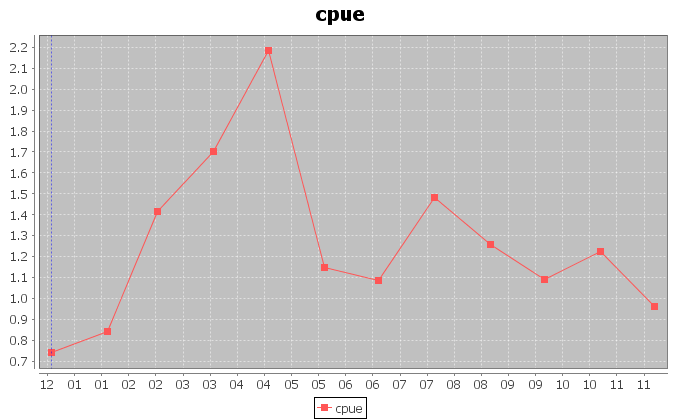
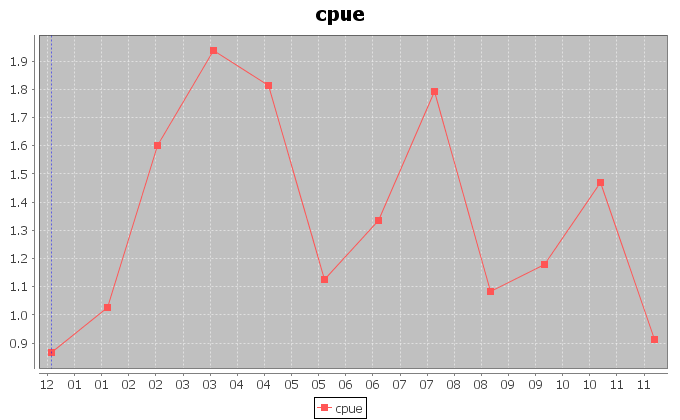
* an overall periodic reduction of the Catch per Unit Effort (CPUE) in the most exploited 10-degrees area.
Approach
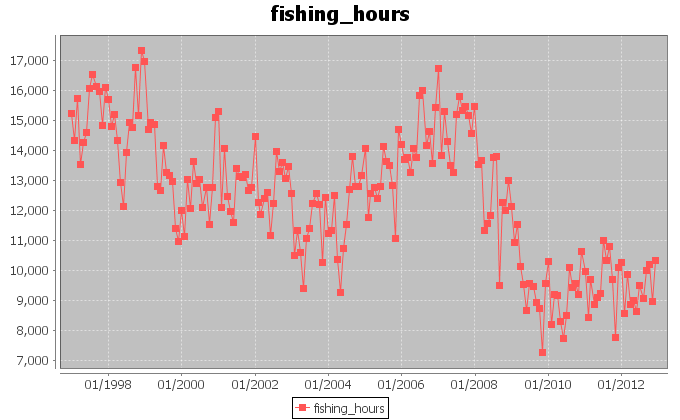
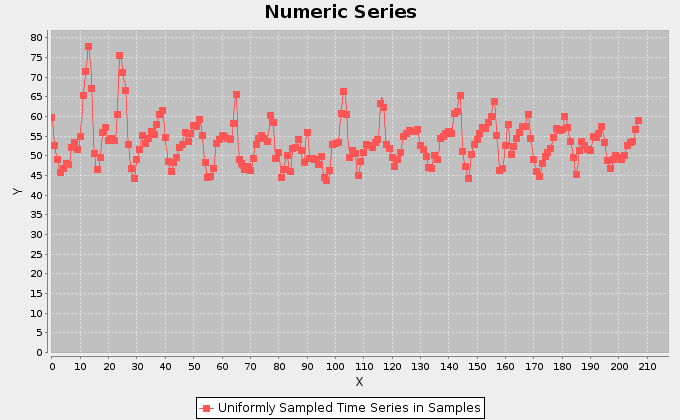
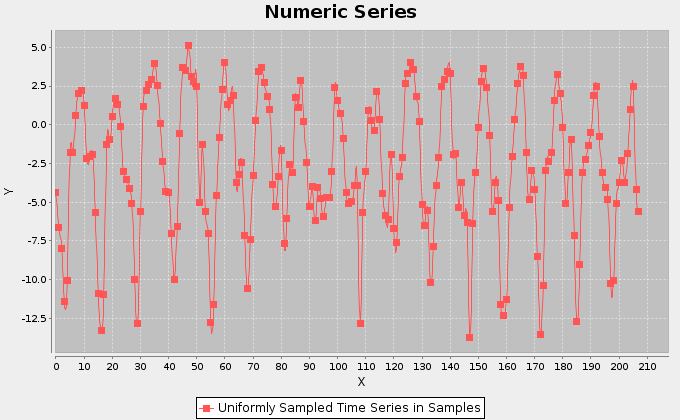
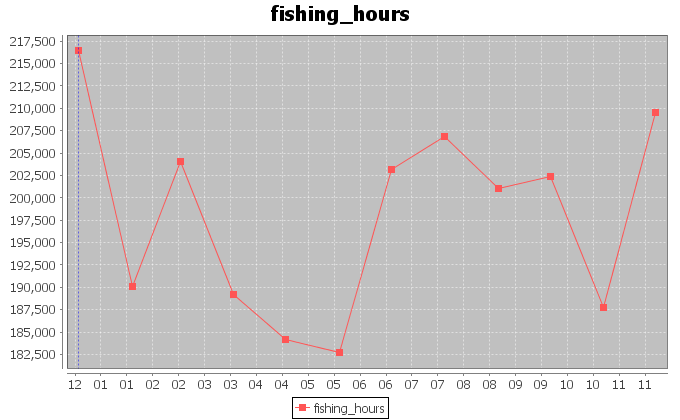
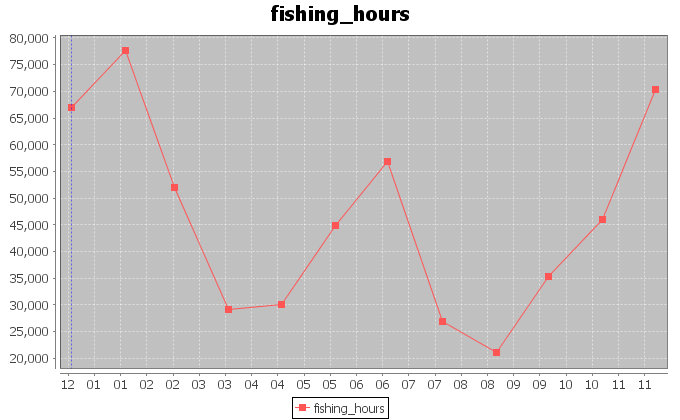
Our first attempt aimed to discover hidden periodicities in the exploitation of the ocean area. Thus, we traced the trend of the fishing hours effort in the period between January 1997 and December 2012. We summed the hours spent in the same month and eventually obtained the trend in figure 1.
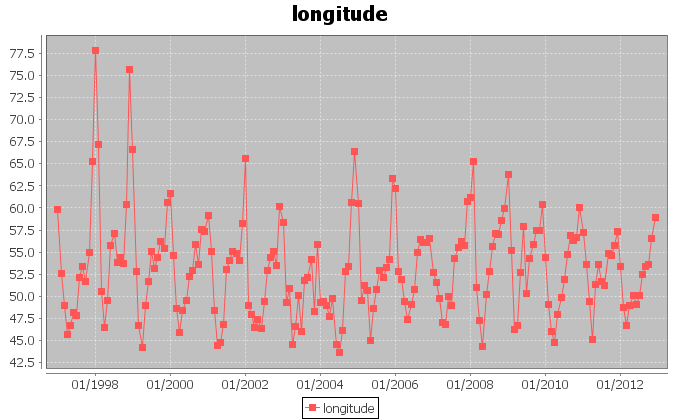
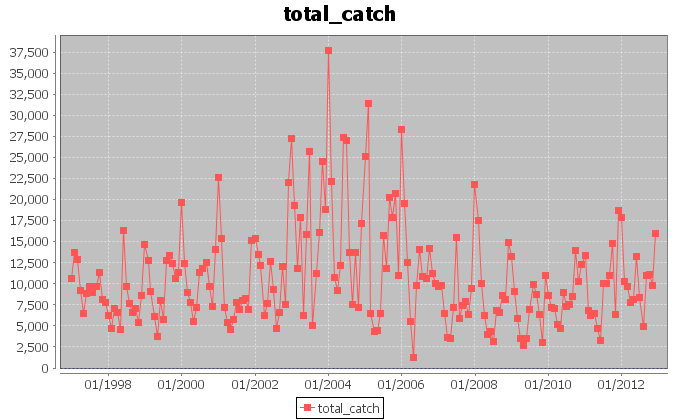
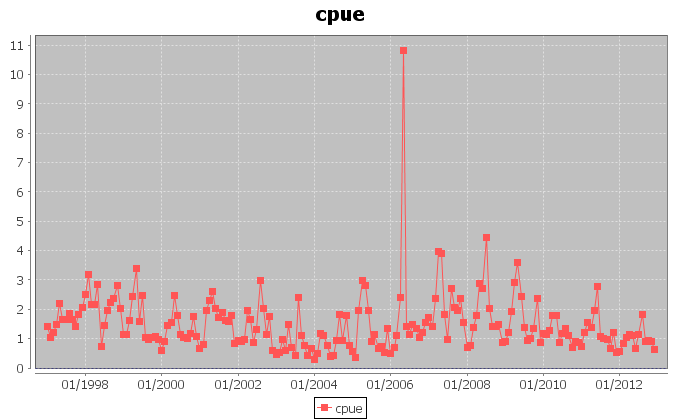
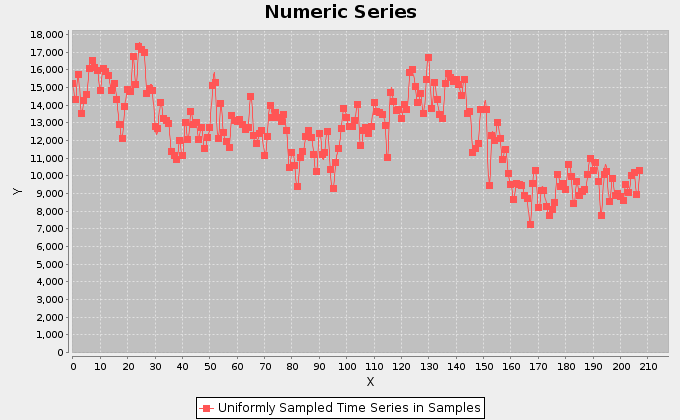
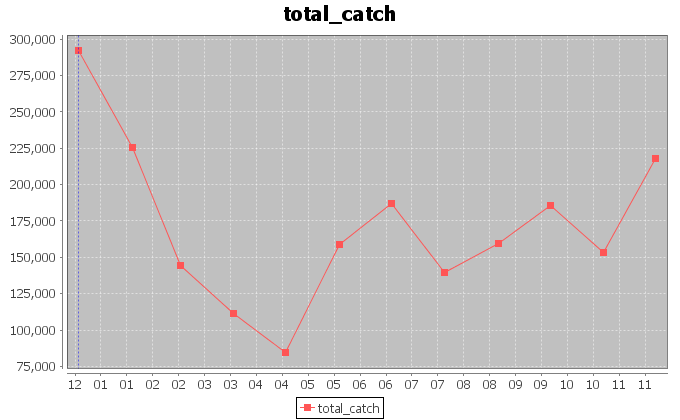
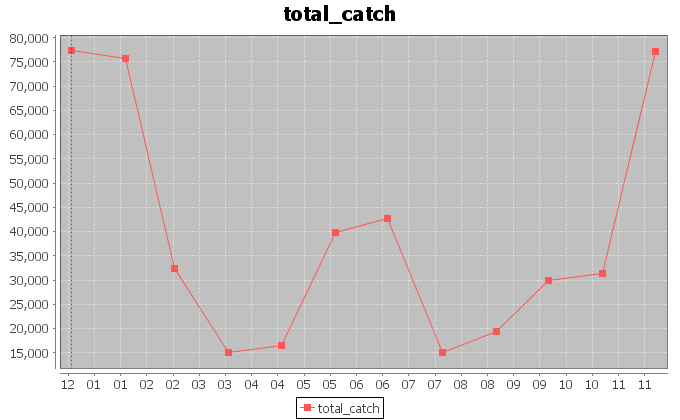
Furthermore, we associated the fishing hours in one single month to the barycenter of the areas interested by the fishing activity in that month. The monthly barycenters were calculated by weighting each 1 degree cell in the original dataset according to the fishing hours spent in that month in the cell. The resulting dataset can be found here. This contains unfolded information about the barycenters coordinates and their distance from the origin of the reference system. Figure 2 and 3 display the trends for the longitudes and latitudes of the barycenter. The signals show a periodic behaviour, which we investigated more accurately. In figures 4 and 5 we report the trends for the amount of catch in tonnes of the Yellowfin Tuna and the related catch per unit of effort (CPUE) calculated as the ratio between the catch and the fishing hours.
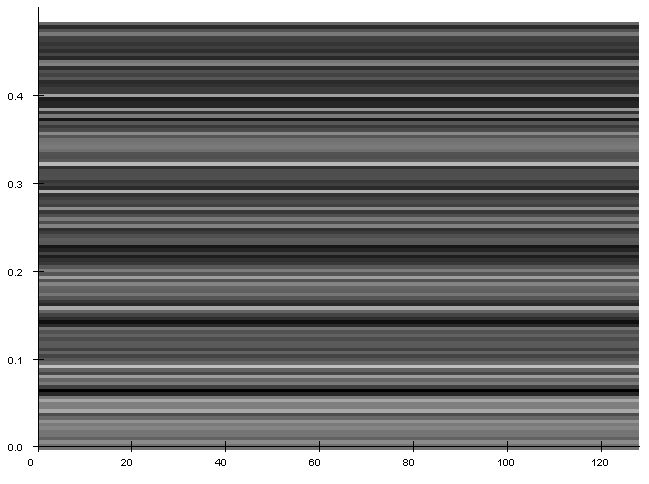
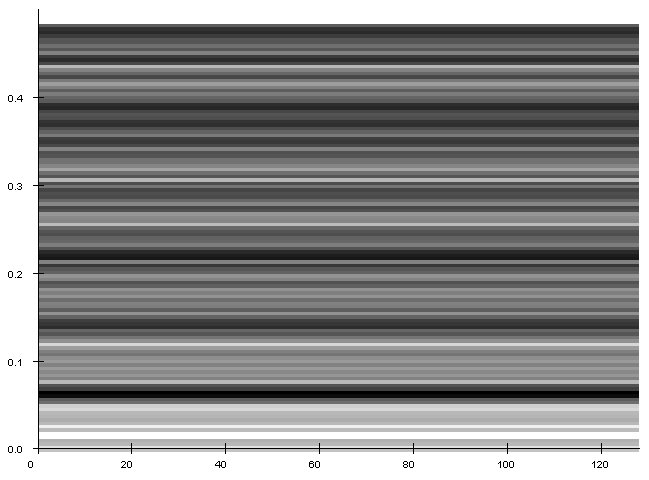
In order to inspect the periodic behaviour of the trends of the coordinates, we applied Fourier analysis to the signals and traced the spectrograms. In both the cases, the analysis detected a period of 51.0 samples with indecision in the interval [56.64 , 46.38] , which corresponds to a periodic exploitation of some areas after 51 months.
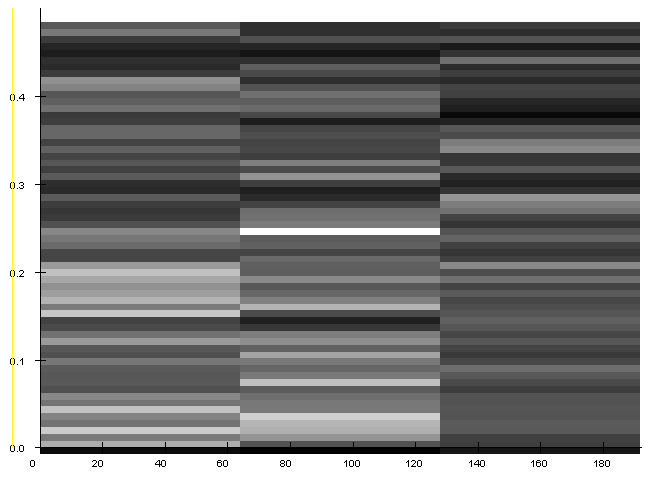
Fishing effort, instead, is not a stationary signal, thus we tried to inspect its hidden periodicities by means of a Short-Time Fourier analysis. The analysis was made on chunks of the signal with quite stationary mean and variance in the samples values.
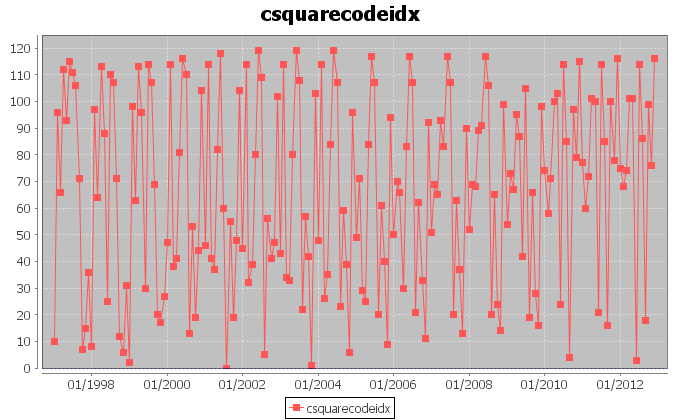
We also report the trend of the Csquare codes associated to the barycenters. Each code was assigned to an index and the chart displays the distribution of such indexes in time. This is one way to report a bidimensional occurrence on one dimension.The trend of the indexes is periodic and this is due to the periodic trend in longitudes and latitudes.
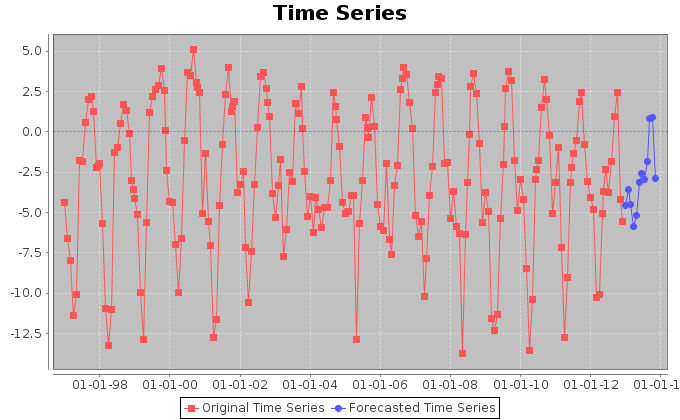
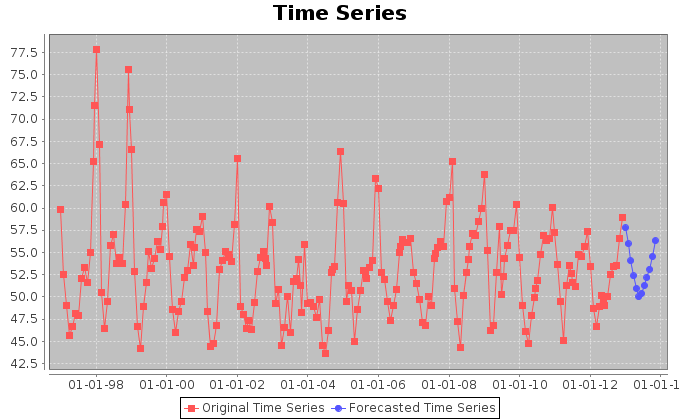
Finally, we tried to forecast the coordinates trends in order to understand which places could be interested by exploitation in the 12 next months. To such aim we used Singular Spectrum Analysis. The forecasts confirm the periodic nature of the signals.
We applied the same analysis to the fishing hours trend. The analysis detected a weak periodicity of 12.91 samples with indecision interval between 13.25 and 12.59. Furthermore, the forecast suggests that the amount of hours per month is going to oscillating aroung lower values in average, with respect to the previous years. A periodic behaviour of 12 months is visible, which demonstrates that the latitude components is more relevant for latitude than for longitude.
Aggregation on 12 Months
We repeated the same analysis aggregating the fishing hours on 12 months. The figure above displays the trends we extracted after the aggregation. The periodic nature of the fishing activity is no more visible, except for the latitudes of the barycenters. In this case.
Analysis on the Most Exploited Csquare
| Csquare code | Exploitation (fishing hours) |
|---|---|
| 3005 | 614135.3 |
| 1005 | 709254.3 |
| 3004 | 513798.8 |
| 3104 | 211621.1 |
| 3006 | 258669.6 |
| 3105 | 24718.3 |
| 1004 | 12235.1 |
| 3004 | 513798.8 |
| 3007 | 33038.7 |
As last analysis, we investigated on the exploitation of the areas involved in the catch. We selected a coarse grain (10 degrees) and raked the most exploited square areas on 12 months. The trends and the data for each single square can be found here.
In the case of the most exploited area, a periodic trend of 3\4 months is visible in the CPUE chart, but this also indicates that the catch per effort is less and less. This indicates a higher effort with less hours of fishing.
