Difference between revisions of "IOTC Area Predictive analysis"
From D4Science Wiki
(→Analysis on the Most Exploited Csquare) |
(→Analysis on the Most Exploited Csquare) |
||
| Line 47: | Line 47: | ||
===Analysis on the Most Exploited Csquare=== | ===Analysis on the Most Exploited Csquare=== | ||
| − | |||
| − | {| class="wikitable" | + | {| class="wikitable" style="margin: 1em auto 1em auto;" |
|- | |- | ||
! Csquare code | ! Csquare code | ||
| Line 81: | Line 80: | ||
| 33038.7 | | 33038.7 | ||
|- | |- | ||
| + | |+ Most exploited areas at 10 degrees resolution | ||
|} | |} | ||
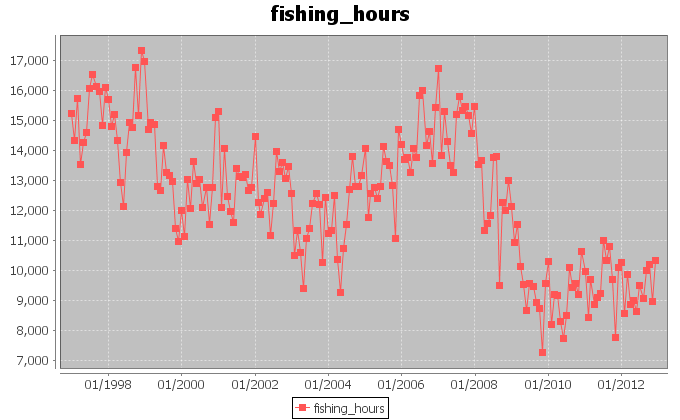
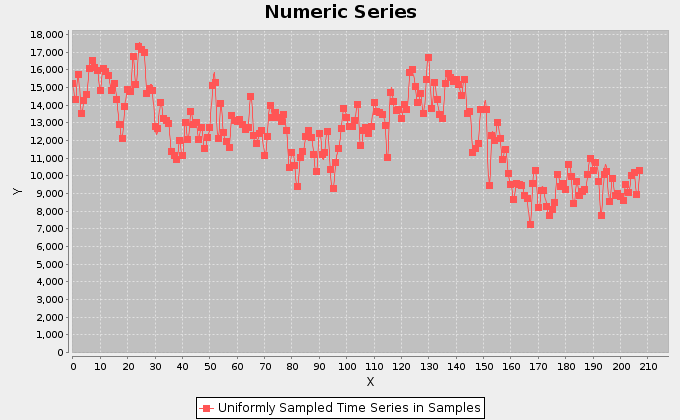
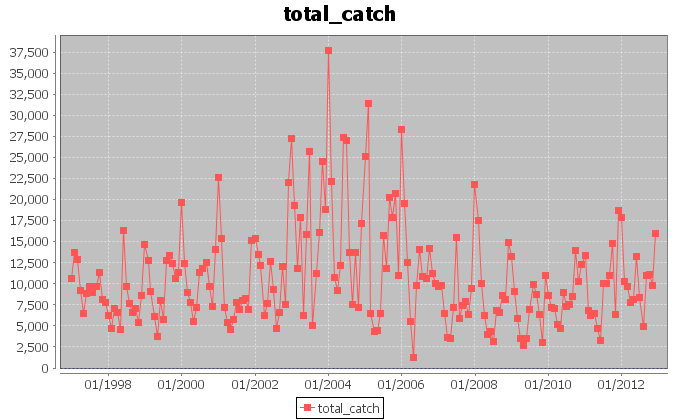
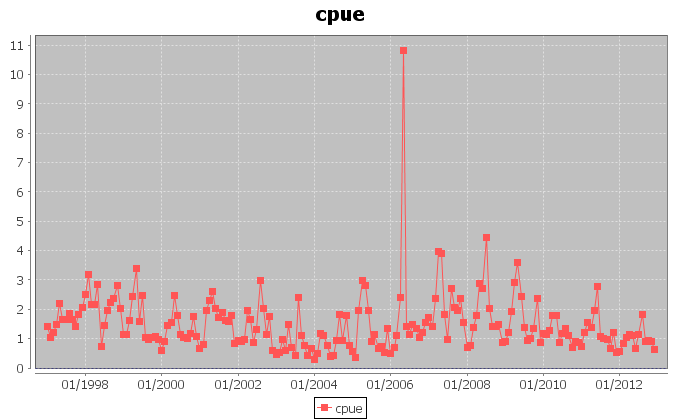
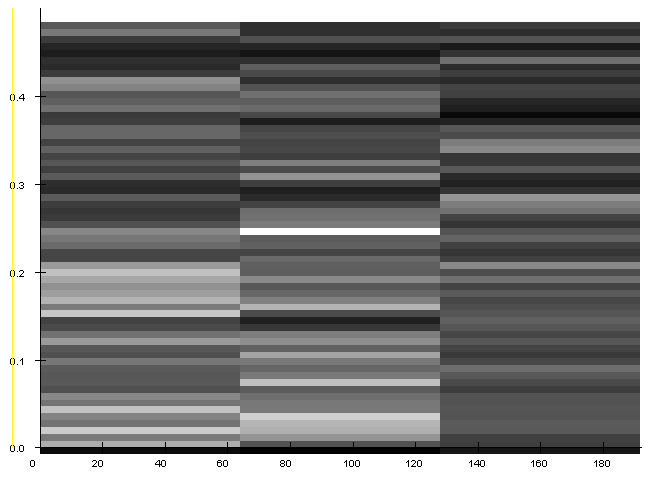
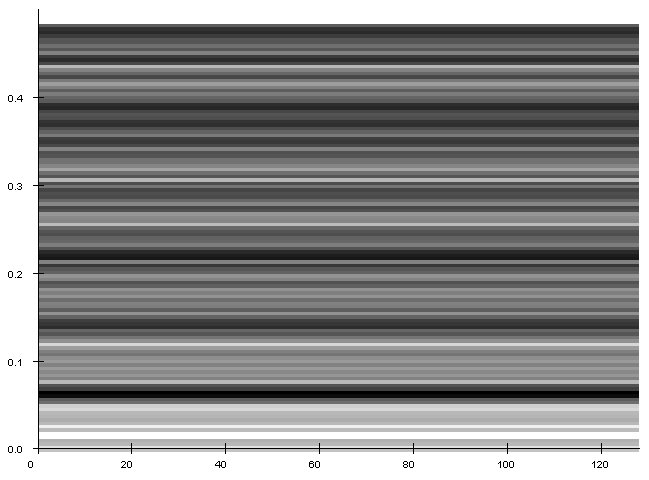
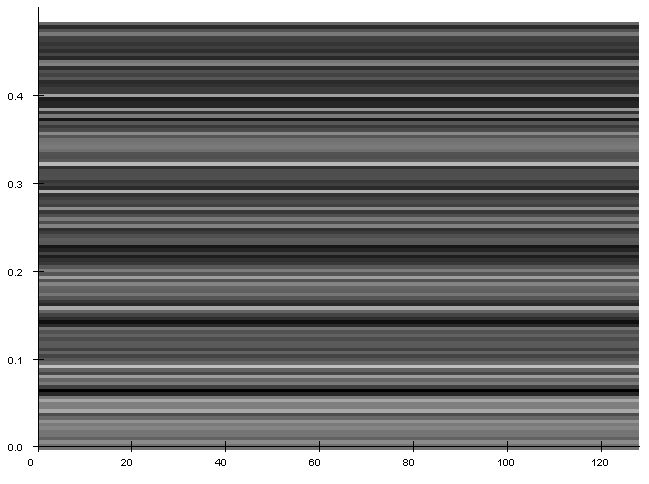
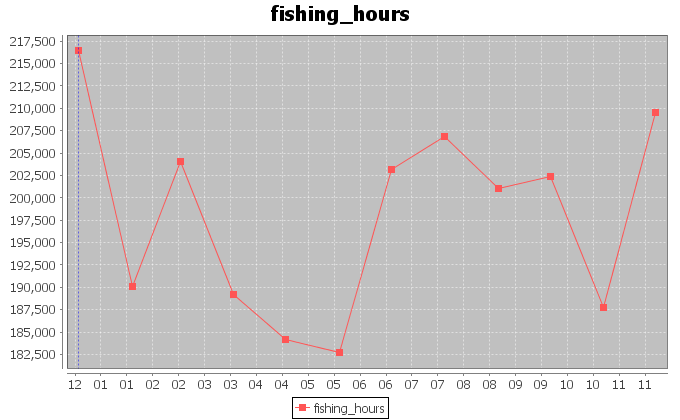
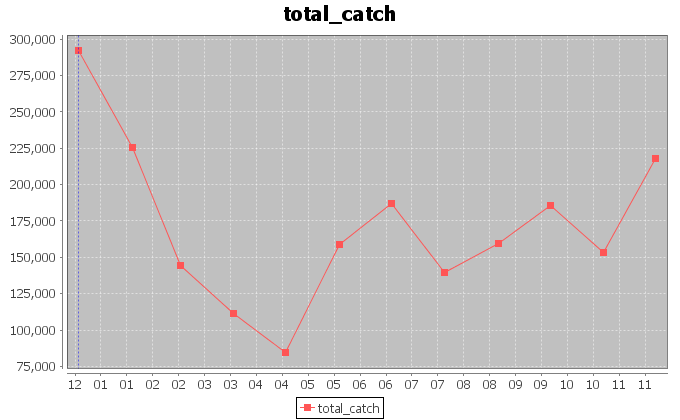
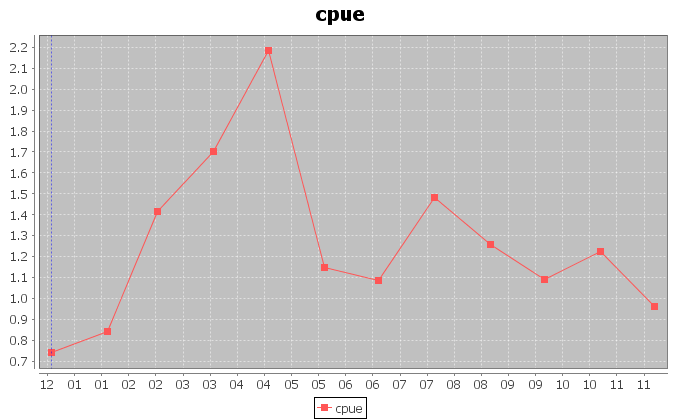
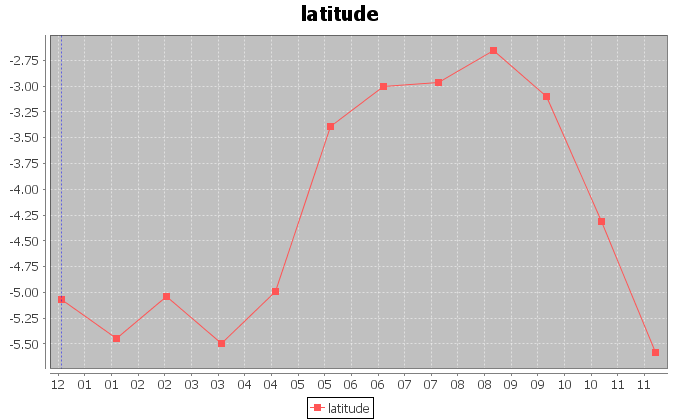
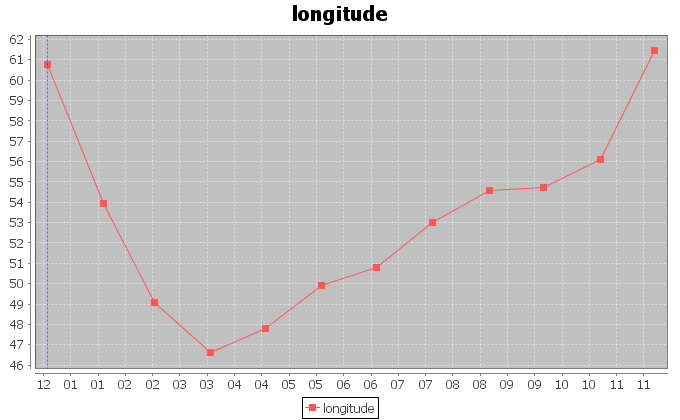
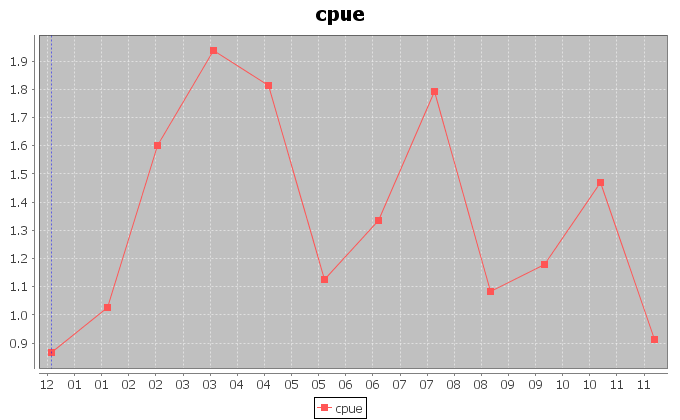
[[Image:month12_3005cpue.png|frame|center|Aggregation on 12 months of the CPUE for the most exploited ares with csquare code 3005.]] | [[Image:month12_3005cpue.png|frame|center|Aggregation on 12 months of the CPUE for the most exploited ares with csquare code 3005.]] | ||
Revision as of 11:57, 21 May 2014
Description
Hypothesis and Thesis
Approach
Aggregation on 12 Months
Analysis on the Most Exploited Csquare
| Csquare code | Exploitation (fishing hours) |
|---|---|
| 3005 | 614135.3 |
| 1005 | 709254.3 |
| 3004 | 513798.8 |
| 3104 | 211621.1 |
| 3006 | 258669.6 |
| 3105 | 24718.3 |
| 1004 | 12235.1 |
| 3004 | 513798.8 |
| 3007 | 33038.7 |
