Difference between revisions of "IOTC Area Predictive analysis"
From D4Science Wiki
(→Approach) |
(→Approach) |
||
| Line 6: | Line 6: | ||
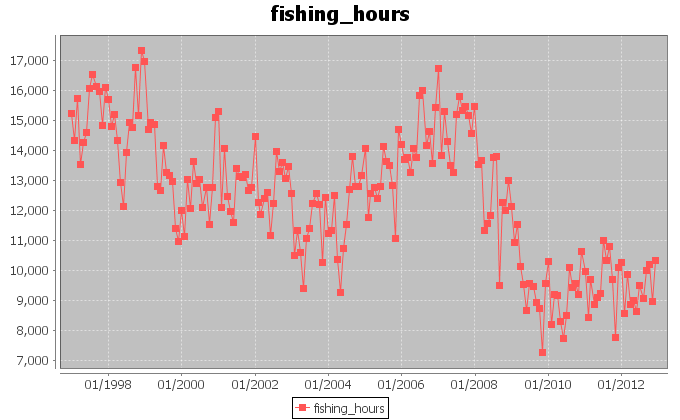
[[Image:barycentereffort.png|frame|center|Fishing hours aggregated per month along the entire period January 1997-December 2012]] | [[Image:barycentereffort.png|frame|center|Fishing hours aggregated per month along the entire period January 1997-December 2012]] | ||
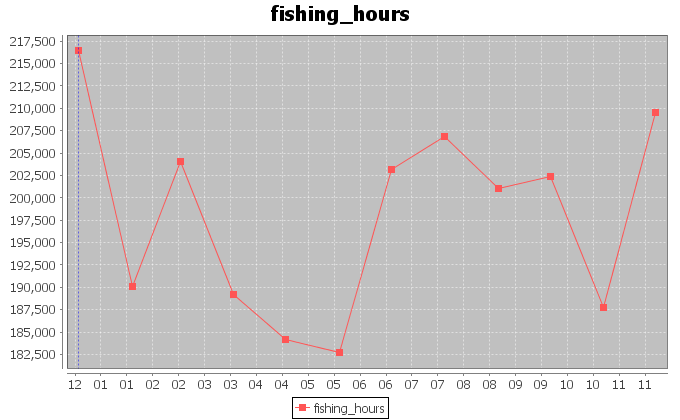
| + | |||
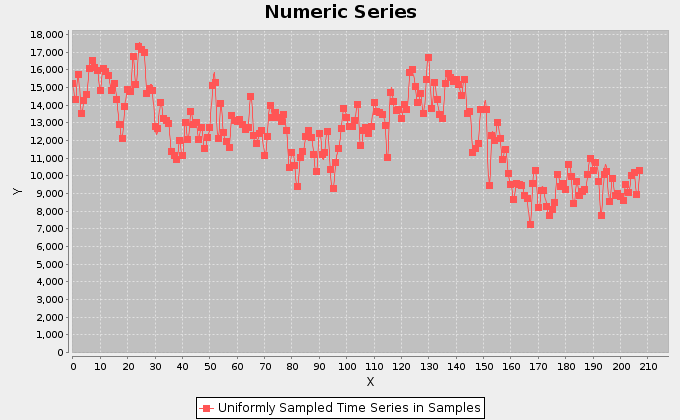
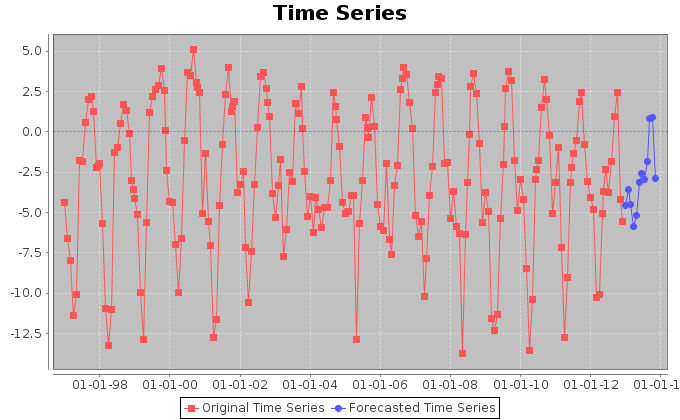
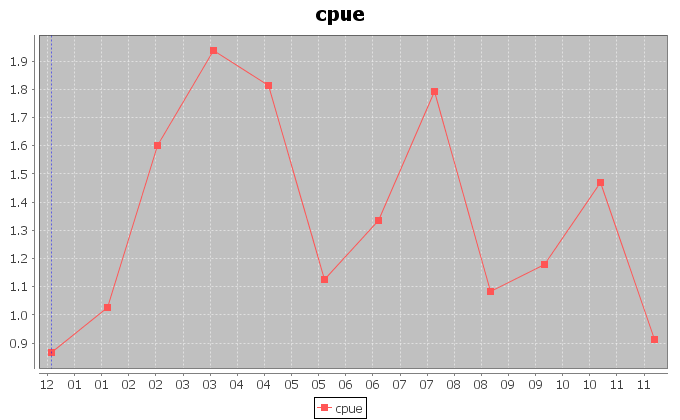
| + | [[Image:barycentereffortsamples.png|frame|center|Fishing hours trend in samples.]] | ||
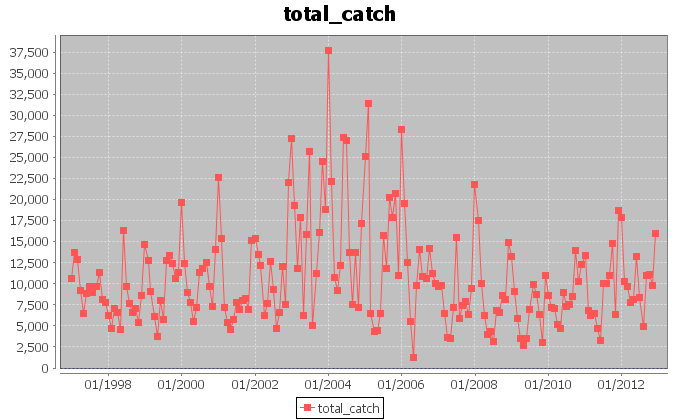
[[Image:barycentercatch.png|frame|center|Catch quantity in tonnes for Yellofin Tuna, in the entire period January 1997-December 2012]] | [[Image:barycentercatch.png|frame|center|Catch quantity in tonnes for Yellofin Tuna, in the entire period January 1997-December 2012]] | ||
| Line 12: | Line 14: | ||
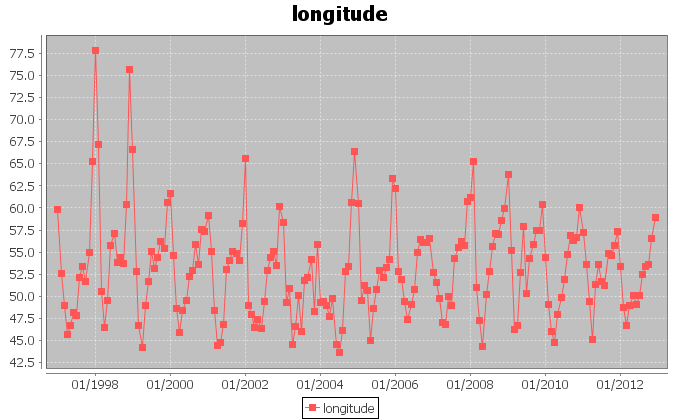
[[Image:barycenterlongitude.png|frame|center|Distribution of the vessels longitudes for Yellofin Tuna by Purse Seine technique, in the entire period January 1997-December 2012]] | [[Image:barycenterlongitude.png|frame|center|Distribution of the vessels longitudes for Yellofin Tuna by Purse Seine technique, in the entire period January 1997-December 2012]] | ||
| + | |||
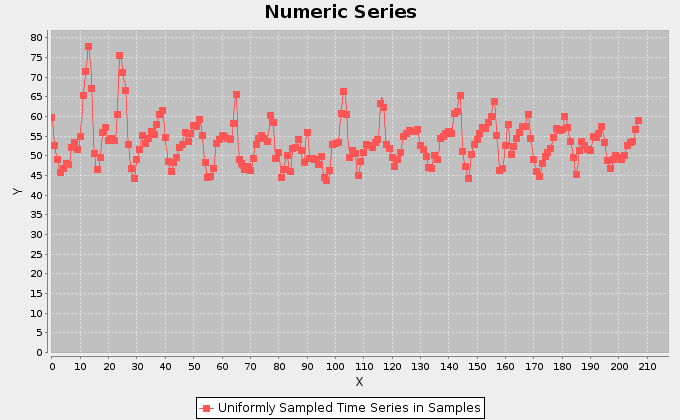
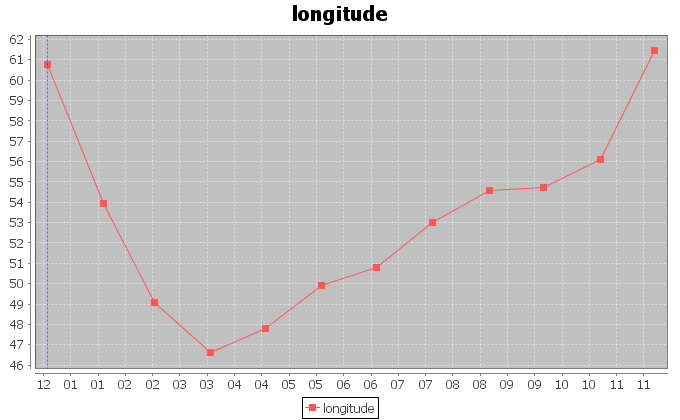
| + | [[Image:barycenterlongitudesamples.png|frame|center|Longitude trend in samples.]] | ||
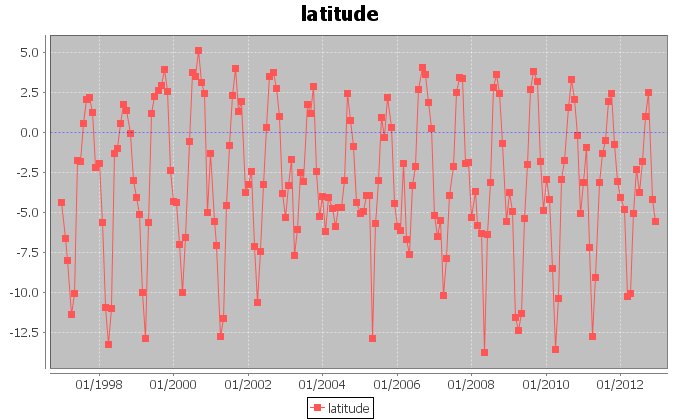
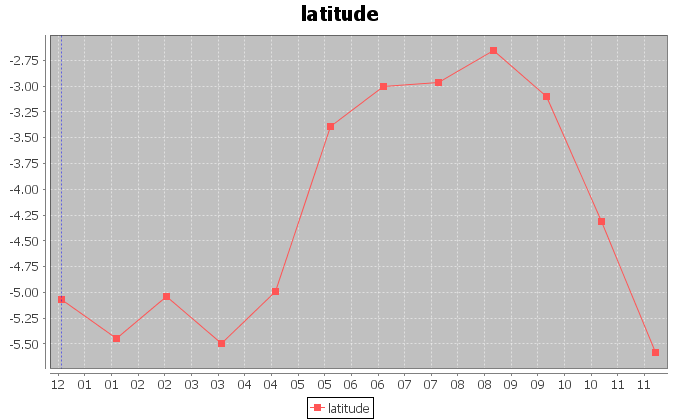
[[Image:barycenterlatitude.png|frame|center|Distribution of the vessels latitudes for Yellofin Tuna by Purse Seine technique, in the entire period January 1997-December 2012]] | [[Image:barycenterlatitude.png|frame|center|Distribution of the vessels latitudes for Yellofin Tuna by Purse Seine technique, in the entire period January 1997-December 2012]] | ||
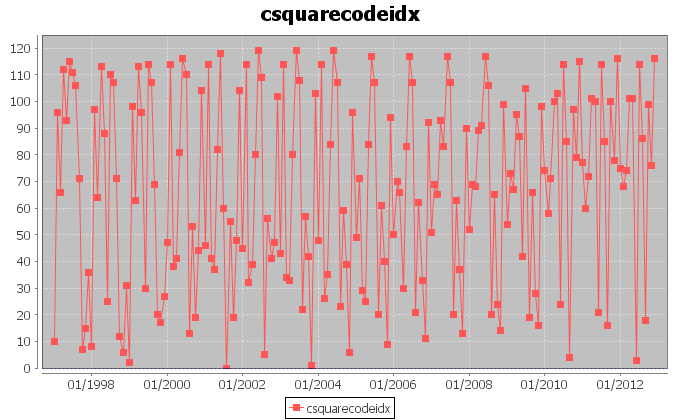
[[Image:barycentercsquares.png|frame|center|Distribution of the presence of vessels on 1 degree csquares, in the entire period January 1997-December 2012]] | [[Image:barycentercsquares.png|frame|center|Distribution of the presence of vessels on 1 degree csquares, in the entire period January 1997-December 2012]] | ||
| + | |||
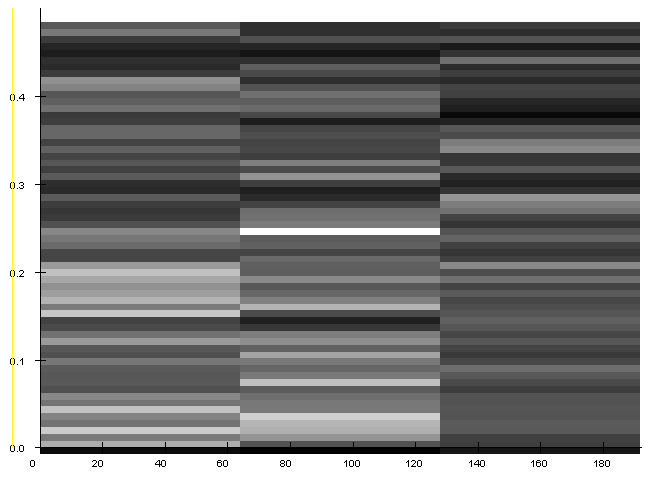
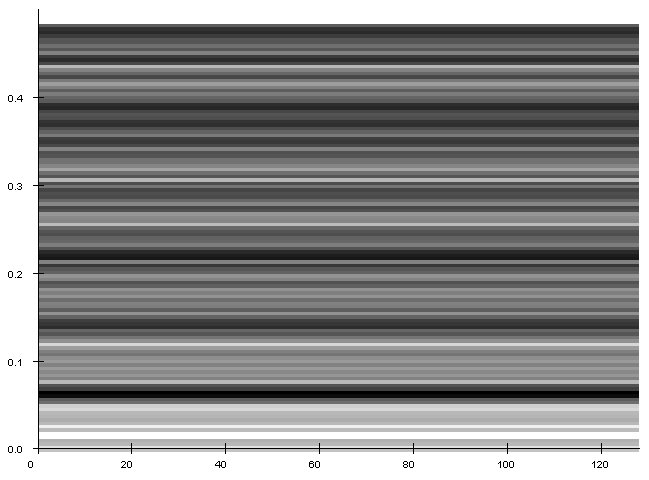
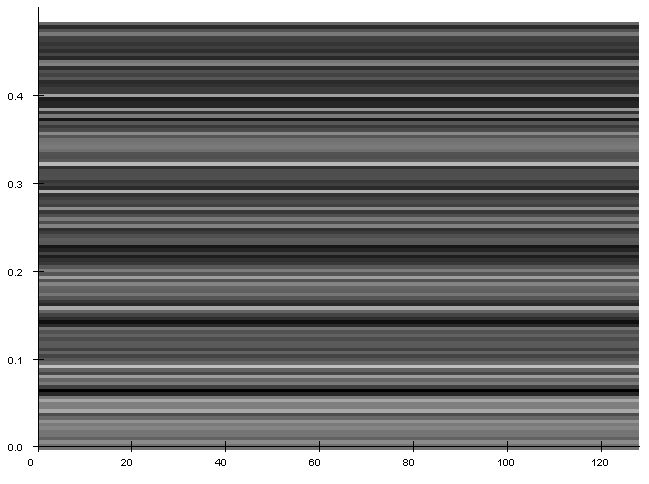
| + | [[Image:barycenterspectrogrameffort.png|frame|center|Spectrogram for the fishing hours trend.]] | ||
[[Image:barycenterspectrogramlatitude.png|frame|center|Spectrogram for the latitude trend.]] | [[Image:barycenterspectrogramlatitude.png|frame|center|Spectrogram for the latitude trend.]] | ||
Revision as of 11:10, 21 May 2014
Description
Hypothesis and Thesis
Approach
