Difference between revisions of "Integrate SPREAD algorithms in Statistical Manager"
(→Recommendations & future developments) |
(→Hypothesis and Thesis) |
||
| (One intermediate revision by the same user not shown) | |||
| Line 1: | Line 1: | ||
== Hypothesis and Thesis == | == Hypothesis and Thesis == | ||
| − | |||
| − | |||
This experiment is performed by FAO in order to further test and assess how data managers / developers can plug easily algorithms (especially R algorithms) in the infrastructure, through the Statistical Manager tool, and respond quickly to data analysis needs while benefiting of iMarine computing resources. | This experiment is performed by FAO in order to further test and assess how data managers / developers can plug easily algorithms (especially R algorithms) in the infrastructure, through the Statistical Manager tool, and respond quickly to data analysis needs while benefiting of iMarine computing resources. | ||
| Line 31: | Line 29: | ||
== Conclusion == | == Conclusion == | ||
| − | + | This experiment led to plug very quickly 2 SPREAD algorithms, one generic, and one simplified tailored to FAO-FI users. The activity was performed in one day, from the preparation of R script & associated Java Statistical Manager plugin, to the deployment & test. This second experiment highlighted again the efficiency of the procedure of algorithm integration, and very prompt support was given by the Statistical Manager team. | |
| + | |||
| + | Additional interaction will be done with the Statistical Manager team to see how to make the SPREAD algorithm much more flexible in term of inputs (e.g. extend SDMX data input to CSV, or other formats) in order to make the algorithm execution much more ergonomic and confortabl for the end users, especially in FAO FI. | ||
== Recommendations & future developments == | == Recommendations & future developments == | ||
Latest revision as of 09:04, 24 June 2014
Hypothesis and Thesis
This experiment is performed by FAO in order to further test and assess how data managers / developers can plug easily algorithms (especially R algorithms) in the infrastructure, through the Statistical Manager tool, and respond quickly to data analysis needs while benefiting of iMarine computing resources.
The product of this experiment include two Spatial Data Reallocation (SPREAD) algorithms:
- one generic, with more parameters
- one simplified, in order to better adjust SPREAD needs of the FAO Fisheries & Aquaculture department
The scope of these algorithm integration experiments is:
- developer/algorithm integrator oriented
- to assess how a data manager / developer can plug an algorithm by their own,
- to identify potential improvements for the ease, speed and sustainability of the R algorithm integration procedure
- end-user oriented
- to assess user friendliness of the Statistical Manager data analysis tool
Outcome
The results of this experiment confirm the results of the first experiment (SDMX Data converter) and show that the procedure of integrating R scripts as data analysis algorithms is a quick, straightforward and sustainable.
In addition to the outcome of the first experiment, the present experiment highlighted the flexibility of the Statistical Manager and its capacity to simplify algorithms inputs to guarantee user-friendliness of the algorithm execution by the end-user.
Activity Workflow
- The activity consisted in adding the two algorithms (both R script & wrapping Java class) to the statistical-manager-figis-algorithms project that hosts FAO experiments, along with performing tests.
- The updated archives and R scripts where shared with the Statistical Manager team
- The Statistical Manager team deployed the algorithms in the iMarine development portal
Conclusion
This experiment led to plug very quickly 2 SPREAD algorithms, one generic, and one simplified tailored to FAO-FI users. The activity was performed in one day, from the preparation of R script & associated Java Statistical Manager plugin, to the deployment & test. This second experiment highlighted again the efficiency of the procedure of algorithm integration, and very prompt support was given by the Statistical Manager team.
Additional interaction will be done with the Statistical Manager team to see how to make the SPREAD algorithm much more flexible in term of inputs (e.g. extend SDMX data input to CSV, or other formats) in order to make the algorithm execution much more ergonomic and confortabl for the end users, especially in FAO FI.
Recommendations & future developments
In addition to the recommendations given in the R_algorithm_integration_with_Statistical_Manager first experiment, additional comments were shared with the Statistical Manager team, highlighting essentially that the configuration of input parameters should be enriched with automated validation rules, to make the right values passed to the R context. At now the algorithm integrator has to make sure he validates each input parameter, otherwise errors will occur when input parameters values will be sent to the R context.
For example:
- for a string, he has to quote the string
- for a boolean, he has to be be sure it's sent to the R context as uppercase
Experimentation
- The two algorithms were plugged very quickly in the Statistical Manager
- The simplified algorithm allows FI - FIPS users to familiarize & use quickly the SPREAD algorithm, as it makes easier specifying the intersections to use for the spatial reallocation. At now the the dataset has to be input as SDMX
- In this experiment, we proceed to the spatial reallocation:
- of a global catch dataset for the species Atlantic herring, from 1990 to 2010. The SDMX request is http://data.fao.org/sdmx/repository/data/CAPTURE/..HER/FAO/?startPeriod=1990&endPeriod=2010 for which catches are reported by FAO major area (FAO_MAJOR_AREA)
- from FAO major area to EEZ - High seas
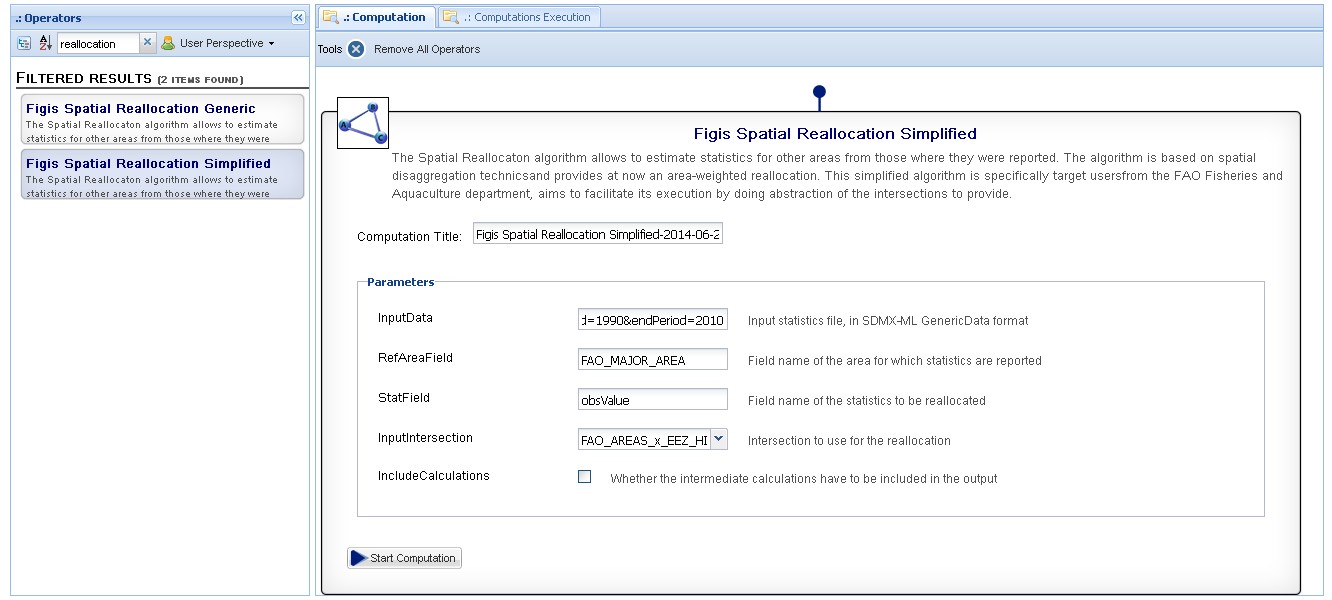
View 1: View of the Statistical Manager, after filtering on "reallocation", the 2 algorithms newly added appear. Use of the simplified algorithm, where:
- the SDMX getdata url is input,
- the reference area corresponds to its name as referenced in the SDMX (FAO_MAJOR_AREA),
- the statField corresponds to its name in the SDMX (obsValue)
- we select FAO_AREAS_x_EEZ_HIGHSEAS as intersection (reallocate from FAO AREAS to EEZ - highseas)
- we leave unchecked "include Computations", as we want the final dataset aggregated by EEZ - highseas
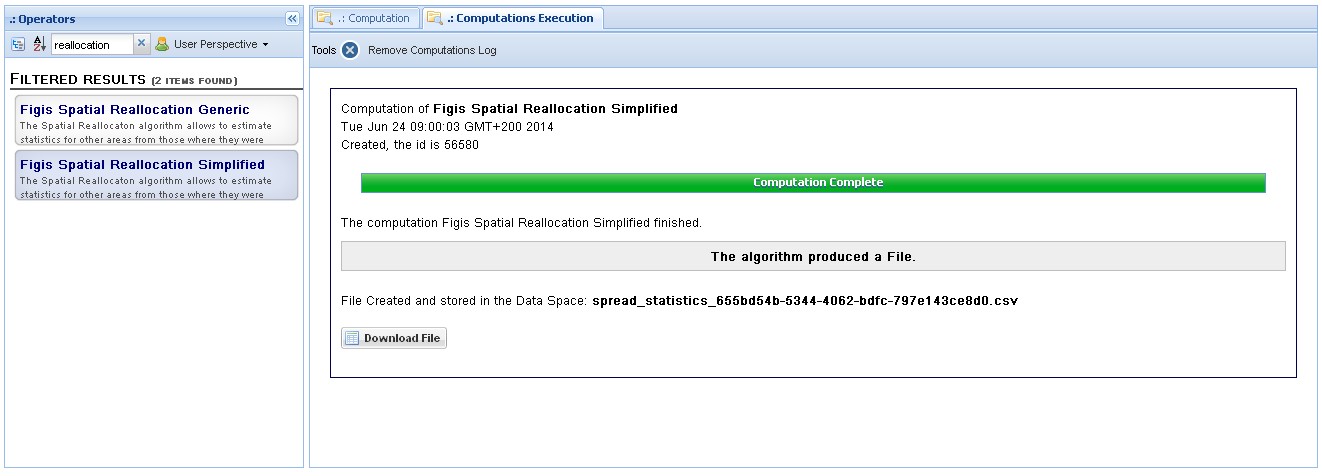
View 2: Result of the computation, where the reallocated dataset is available for download as CSV.
Related links
- How to implement algorithms for the Statistical Manager
- Implement Statistical Manager algorithms - tutorial video
- rsdmx package for R used for the reading SDMX-ML catch data in R
- RFigisGeo package for R used for reading intersections & performing the spatial data reallocation

