Difference between revisions of "ICES SGVMS"
(→Conclusion) |
|||
| (9 intermediate revisions by one other user not shown) | |||
| Line 6: | Line 6: | ||
The scope of the SGVMS is to supply ICES expert groups with information and highlights. Interested groups would manage the following fields of research: bird ecology, marine mammal ecology, spatial planning, socio-economics. The products of the SGVMS analyses involve (i) spatially detailed maps of fishing effort by métier, (ii) trends in effort over time and (iii) identification of regions unimpacted by certain gears. | The scope of the SGVMS is to supply ICES expert groups with information and highlights. Interested groups would manage the following fields of research: bird ecology, marine mammal ecology, spatial planning, socio-economics. The products of the SGVMS analyses involve (i) spatially detailed maps of fishing effort by métier, (ii) trends in effort over time and (iii) identification of regions unimpacted by certain gears. | ||
| − | Starting from this point, the scope of this experiment is to show what the | + | Starting from this point, the scope of this experiment is to show what the D4Science e-Infrastructure can add to the SGVMS procedures. |
In particular, we want to answer to the following questions: | In particular, we want to answer to the following questions: | ||
| − | * Which enhancements can importing SGVMS tools in the | + | * Which enhancements can importing SGVMS tools in the D4Science e-Infrastructure bring to the original process? |
* Which is the performance of the resulting process? | * Which is the performance of the resulting process? | ||
| Line 44: | Line 44: | ||
# The procedures cannot manage synchronous calls by different users, producing different outputs. | # The procedures cannot manage synchronous calls by different users, producing different outputs. | ||
| − | + | D4Science is endowed with a [https://wiki.gcube-system.org/gcube/index.php/How-to_Implement_Algorithms_for_the_Statistical_Manager#Integrating_R_Scripts framework] to import Vessels processing scripts, written in R language. Furthermore, it accommodates the above requirements by means of input\output standardization and e-Infrastructure facilities. | |
These can be summarized in the following: | These can be summarized in the following: | ||
| Line 55: | Line 55: | ||
# intersection with models developed in other domains (e.g. Aquamaps). | # intersection with models developed in other domains (e.g. Aquamaps). | ||
| − | === Future Development === | + | === Future Development on SGVMS Tools === |
Future development on top of the here presented integration can involve the following points: | Future development on top of the here presented integration can involve the following points: | ||
# Porting of other SGVMS tools onto the e-Infrastructure; | # Porting of other SGVMS tools onto the e-Infrastructure; | ||
| − | # Using | + | # Using D4Science to extend the SGVMS tools, e.g. for producing FishFrame compliant documents; |
| − | # Using | + | # Using D4Science to practically interpolating large vessels tracks; |
# Using Time series analysis tools on vessels tracks; | # Using Time series analysis tools on vessels tracks; | ||
# Extracting backward and forward fishing indicators; | # Extracting backward and forward fishing indicators; | ||
| Line 67: | Line 67: | ||
# Applying clustering to vessels tracks to detect similar behaviors by vessels; | # Applying clustering to vessels tracks to detect similar behaviors by vessels; | ||
# Using Bayesian models to automatically classifying fishing activity. | # Using Bayesian models to automatically classifying fishing activity. | ||
| + | |||
| + | ===Prospects In Using D4Science for VMS Analyses=== | ||
| + | |||
| + | '''Confidentiality''': the data imported and produced by a user are available for that user only. (S)He can decide to share it with other people by means of the e-Infrastructure sharing facilties. Furthermore, R scripts are executed in process sandboxes, which prevent them to install new software or to connect to external systems; | ||
| + | |||
| + | '''Flexibility''': The Statistical Manager platform is able to invoke R scripts even if they run on external computational systems. The Statistical Manager is able to harvest processes published under [http://en.wikipedia.org/wiki/Web_Processing_Service WPS] standard. For such processes, the SM automatically produces a web interface and manages provenance; | ||
| + | |||
| + | '''Extensibility''': users can integrate their own R scripts directly on the SM by themselves, using the [https://wiki.gcube-system.org/gcube/index.php/How-to_Implement_Algorithms_for_the_Statistical_Manager#Integrating_R_Scripts Statistical Manager Java development framework]; | ||
| + | |||
| + | '''Reproducibility''': the structure of our system is meant to support experiments reproducibility. The computation summary gives links to inputs, outputs and parameters. The D4Science sharing facilities allow to distribute such information; | ||
| + | |||
| + | '''Reportability''': [http://wiki.gcube-system.org/gcube/index.php/Document_Workflows automatic services in the D4Science e-Infrastructure] allow to produce reports on top of the produced datasets; | ||
| + | |||
| + | '''Enrichment''': [http://ieeexplore.ieee.org/xpl/articleDetails.jsp?tp=&arnumber=6607976&queryText%3Dcoro methods yet developed in other projects] can be applied to correct speed and course using current and wind data, or to exclude fishing if wave action was too high; | ||
=== Experimentation === | === Experimentation === | ||
| Line 76: | Line 90: | ||
====Performance==== | ====Performance==== | ||
| − | As first step, we evaluated the performance of the R Script when running on one of the | + | As first step, we evaluated the performance of the R Script when running on one of the D4Science machines. The machine was an Intel i7-3770 CPU @3.4 GHz, with 16 GB RAM, running Ubuntu 12.04, 64 bits. |
A summary of the performance is reported in a public document, available [http://goo.gl/f3Y3je here]. | A summary of the performance is reported in a public document, available [http://goo.gl/f3Y3je here]. | ||
| − | The performance in terms of memory are reported in the following figure, which | + | The performance in terms of memory are reported in the following figure, which reports the memory requirement of the script, when run on 97,016 vessels trajectories points requiring 10 minutes resolution. The required memory to completely run the script was more than 20 GB, which is unpractical for a standard desktop machine. |
[[Image:memorySGVMS.png|thumb|center|upright=4.5|Memory usage by VMSTools on 97,016 vessels points interpolations at 10 minutes resolution.]] | [[Image:memorySGVMS.png|thumb|center|upright=4.5|Memory usage by VMSTools on 97,016 vessels points interpolations at 10 minutes resolution.]] | ||
| − | On the other side, we evaluated the computation time required by the script at the variation of the number of points. The next figure shows the exponential nature of the computation time | + | On the other side, we evaluated the computation time required by the script at the variation of the number of points to interpolate. The next figure shows the exponential nature of the computation time |
[[Image:computationTimeSGVMS.png|thumb|center|upright=4.5|Variation in the computation time with respect to the number of vessels points to process.]] | [[Image:computationTimeSGVMS.png|thumb|center|upright=4.5|Variation in the computation time with respect to the number of vessels points to process.]] | ||
| + | |||
| + | Note: '''the script has also the possibility to be run with lower memory requirements, which takes much higher time and was not focused by this analysis.''' | ||
====Integration Result==== | ====Integration Result==== | ||
| − | We integrated the script with the | + | We integrated the script with the D4Science e-Infrastructure facilities. This required to build an algorithm for the Statistical Manager platform. The Statistical Manager comes with a [https://wiki.gcube-system.org/gcube/index.php/How-to_Implement_Algorithms_for_the_Statistical_Manager#Integrating_R_Scripts development framework] to rapidly integrate R Scripts. |
The added value of this framework is that it automatically accounts for multiple users requests even if the input\output of the R script is static. This is achieved by performing on-the-fly code injection. | The added value of this framework is that it automatically accounts for multiple users requests even if the input\output of the R script is static. This is achieved by performing on-the-fly code injection. | ||
| − | The result of such activity was that the procedure was deployed on the | + | The result of such activity was that the procedure was deployed on the D4Science e-Infrastructure. This automatically endowed it with a user interface, and with facilities for data sharing and provenance maintenance. |
| + | |||
The next figure shows the interface to the procedure automatically generated by the e-Infrastructure, on the basis of the inputs\outputs specifications | The next figure shows the interface to the procedure automatically generated by the e-Infrastructure, on the basis of the inputs\outputs specifications | ||
[[Image:InterfaceSGVMS.png|thumb|center|upright=4.5|Interface for the Vessels interpolation procedure. The interface was automatically produced by the Statistical Manager.]] | [[Image:InterfaceSGVMS.png|thumb|center|upright=4.5|Interface for the Vessels interpolation procedure. The interface was automatically produced by the Statistical Manager.]] | ||
| − | The Statistical Manager dataspace environment reports the used inputs and the produced outputs | + | The Statistical Manager dataspace environment reports the used inputs and the produced outputs, where the distinction between them is in the metadata, which indicate if the dataset was "computed" or "imported" |
[[Image:inputsoutputsSGVMS.png|thumb|center|upright=4.5|A summary of the TACSAT2 files produced by the computations. Note that inputs are separated from outputs by the Imported\Computed indication.]] | [[Image:inputsoutputsSGVMS.png|thumb|center|upright=4.5|A summary of the TACSAT2 files produced by the computations. Note that inputs are separated from outputs by the Imported\Computed indication.]] | ||
| Line 105: | Line 122: | ||
[[Image:checkcomp2SGVMS.png|thumb|center|upright=4.5|Report of the output produced by a previously run process.]] | [[Image:checkcomp2SGVMS.png|thumb|center|upright=4.5|Report of the output produced by a previously run process.]] | ||
| − | |||
=== Related links === | === Related links === | ||
| − | [http:// | + | [http://wiki.gcube-system.org/gcube/index.php/Statistical_Manager_Tutorial A tutorial on the Statistical Manager] |
| − | [http:// | + | [http://wiki.gcube-system.org/gcube/index.php/How-to_Implement_Algorithms_for_the_Statistical_Manager Implementing algorithms with the Statistical Manager Framework] |
| − | [http:// | + | [http://wiki.gcube-system.org/gcube/index.php/How_to_Interact_with_the_Statistical_Manager_by_client Using the Statistical Manager by external thin clients] |
| − | [https:// | + | [https://services.d4science.org/group/biodiversitylab/processing-tools The Statistical Manager interface on the D4Science Portal (Biodiversity Lab VRE)] |
Latest revision as of 17:19, 3 September 2015
Hypothesis and Thesis
The premise of this activity was a review of the ICES procedure for interpolating Vessels routes. A feasibility study was produced on the basis of the 2012 report by the Study Group on VMS data (SGVMS) on vessels data analysis.
Our review is available at the following address: http://goo.gl/risQre
The scope of the SGVMS is to supply ICES expert groups with information and highlights. Interested groups would manage the following fields of research: bird ecology, marine mammal ecology, spatial planning, socio-economics. The products of the SGVMS analyses involve (i) spatially detailed maps of fishing effort by métier, (ii) trends in effort over time and (iii) identification of regions unimpacted by certain gears.
Starting from this point, the scope of this experiment is to show what the D4ScienceAn e-Infrastructure operated by the D4Science.org initiative. e-InfrastructureAn operational combination of digital technologies (hardware and software), resources (data and services), communications (protocols, access rights and networks), and the people and organizational structures needed to support research efforts and collaboration in the large. can add to the SGVMS procedures.
In particular, we want to answer to the following questions:
- Which enhancements can importing SGVMS tools in the D4ScienceAn e-Infrastructure operated by the D4Science.org initiative. e-InfrastructureAn operational combination of digital technologies (hardware and software), resources (data and services), communications (protocols, access rights and networks), and the people and organizational structures needed to support research efforts and collaboration in the large. bring to the original process?
- Which is the performance of the resulting process?
In this experiment we give an answer to the above questions.
Outcome
The results of this experiment highlight that there are advantages in integrating SGVMS tools in the e-InfrastructureAn operational combination of digital technologies (hardware and software), resources (data and services), communications (protocols, access rights and networks), and the people and organizational structures needed to support research efforts and collaboration in the large.. We demonstrate this with a practical example on Vessels points interpolation.
We summarize benefits in the following:
- The e-InfrastructureAn operational combination of digital technologies (hardware and software), resources (data and services), communications (protocols, access rights and networks), and the people and organizational structures needed to support research efforts and collaboration in the large. allows for executing processes that are highly demanding in terms of hardware resources
- The e-InfrastructureAn operational combination of digital technologies (hardware and software), resources (data and services), communications (protocols, access rights and networks), and the people and organizational structures needed to support research efforts and collaboration in the large. enables multi-tenancy and synchronous interrogation to a standalone procedure containing hardcoded inputs and outputs
- A graphical user interface is automatically generated on top of the procedure
- The e-InfrastructureAn operational combination of digital technologies (hardware and software), resources (data and services), communications (protocols, access rights and networks), and the people and organizational structures needed to support research efforts and collaboration in the large. allows for executing R scripts on powerful machines
- The scripts can potentially be fed with datasets yet available in the e-InfrastructureAn operational combination of digital technologies (hardware and software), resources (data and services), communications (protocols, access rights and networks), and the people and organizational structures needed to support research efforts and collaboration in the large.
- The integration allows non-R programmers to use an R Script
- The system enables automatic provenance management: the history of the experiments, the used inputs and the produced outputs are automatically recorded and stored
- The system allows for inputs, outputs and parameters sharing in easy way
- Information is stored on hi-availability, distributed storage systems
- The procedure can be used by external people, if the process is allowed to be published under WPS standard. Connection is even possible by means of Java thin clients
Activity Workflow
A logbook of the activity, from the requirements to the implementation, can be found here.
Conclusion
Weakness points of the sequential solution by SGVMS were identified from explicit assertions in the SGVMS documents and from our considerations. They can be summarized in the following:
- The SGVMS proposes several approaches to vessels tracks interpolation. Nevertheless, they state that these methods should be compared to each other and should be tested against a high resolution dataset. This would be useful to assess which of the methods most closely reflects reality. They expect that different methods might appear most suitable depending on gear or fleet;
- The users of their platform should be able to (i) understand of the contents of the data being analyzed, (ii) work with a command-line interface environment, (iii) use adequate resources to ensure standardized but meaningful outputs;
- The SGVMS reports and encourages also other approaches to VMS analysis, e.g. Bayesian models to investigate fishing patterns and models to understand the effect of resolution of VMS analysis on benthic impact assessments. On the other side, this requires cross-domain knowledge by users;
- No mention to intersecting ecological models and VMS data is given;
- The procedures cannot manage synchronous calls by different users, producing different outputs.
D4ScienceAn e-Infrastructure operated by the D4Science.org initiative. is endowed with a framework to import Vessels processing scripts, written in R language. Furthermore, it accommodates the above requirements by means of input\output standardization and e-InfrastructureAn operational combination of digital technologies (hardware and software), resources (data and services), communications (protocols, access rights and networks), and the people and organizational structures needed to support research efforts and collaboration in the large. facilities.
These can be summarized in the following:
- separation between final users and developers of the process;
- multi-tenancy an multi-user facilities;
- resources sharing;
- input\output datasets reusability;
- applicability of models from other domains (Bayesian models);
- intersection with models developed in other domains (e.g. Aquamaps).
Future Development on SGVMS Tools
Future development on top of the here presented integration can involve the following points:
- Porting of other SGVMS tools onto the e-InfrastructureAn operational combination of digital technologies (hardware and software), resources (data and services), communications (protocols, access rights and networks), and the people and organizational structures needed to support research efforts and collaboration in the large.;
- Using D4ScienceAn e-Infrastructure operated by the D4Science.org initiative. to extend the SGVMS tools, e.g. for producing FishFrame compliant documents;
- Using D4ScienceAn e-Infrastructure operated by the D4Science.org initiative. to practically interpolating large vessels tracks;
- Using Time series analysis tools on vessels tracks;
- Extracting backward and forward fishing indicators;
- Distributing VMS related aggregated data products through the infrastructure;
- Intersecting VMS/FishFrame data with niche models (Aquamaps) to retrieve the list of species possibly involved in catches;
- Applying clustering to vessels tracks to detect similar behaviors by vessels;
- Using Bayesian models to automatically classifying fishing activity.
Prospects In Using D4ScienceAn e-Infrastructure operated by the D4Science.org initiative. for VMS Analyses
Confidentiality: the data imported and produced by a user are available for that user only. (S)He can decide to share it with other people by means of the e-InfrastructureAn operational combination of digital technologies (hardware and software), resources (data and services), communications (protocols, access rights and networks), and the people and organizational structures needed to support research efforts and collaboration in the large. sharing facilties. Furthermore, R scripts are executed in process sandboxes, which prevent them to install new software or to connect to external systems;
Flexibility: The Statistical Manager platform is able to invoke R scripts even if they run on external computational systems. The Statistical Manager is able to harvest processes published under WPS standard. For such processes, the SM automatically produces a web interface and manages provenance;
Extensibility: users can integrate their own R scripts directly on the SM by themselves, using the Statistical Manager Java development framework;
Reproducibility: the structure of our system is meant to support experiments reproducibility. The computation summary gives links to inputs, outputs and parameters. The D4ScienceAn e-Infrastructure operated by the D4Science.org initiative. sharing facilities allow to distribute such information;
Reportability: automatic services in the D4Science e-Infrastructure allow to produce reports on top of the produced datasets;
Enrichment: methods yet developed in other projects can be applied to correct speed and course using current and wind data, or to exclude fishing if wave action was too high;
Experimentation
As first step, we analyzed the VMSTools suite, published by SGVMS on the google code repository. This suite involves sevaral scripts and procedures to analyze VMS data. We extracted the VMS interpolation procedures from VMSTools. These accept a set of VMS trajectories as input and produce interpolated versions, using either Hermite Cubic Splines or Straight line interpolation. Inputs have to follow the TACSAT2 format. One example of input file can be found here. A sample of interpolated output is visible here.
We produced a single R Script including the necessary VMS tools procedures. The script can be found here. It builds on top of the interpolation and reconstruction functions in the VMSTools.
Performance
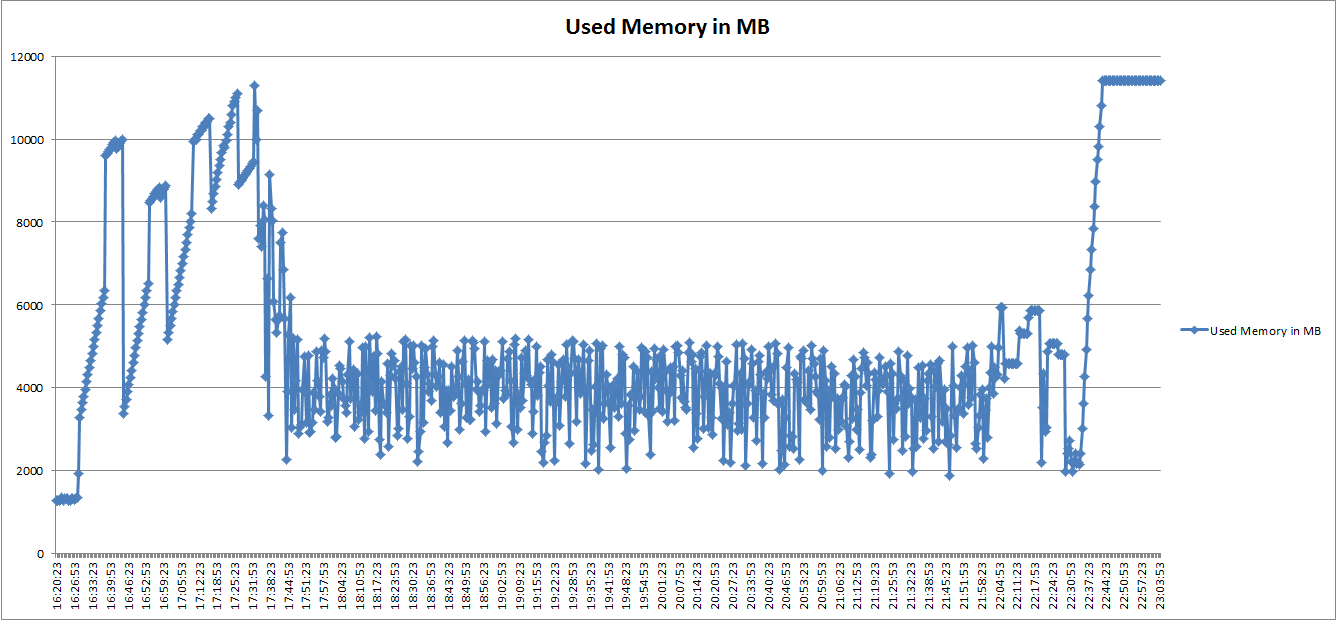
As first step, we evaluated the performance of the R Script when running on one of the D4ScienceAn e-Infrastructure operated by the D4Science.org initiative. machines. The machine was an Intel i7-3770 CPU @3.4 GHz, with 16 GB RAM, running Ubuntu 12.04, 64 bits. A summary of the performance is reported in a public document, available here. The performance in terms of memory are reported in the following figure, which reports the memory requirement of the script, when run on 97,016 vessels trajectories points requiring 10 minutes resolution. The required memory to completely run the script was more than 20 GB, which is unpractical for a standard desktop machine.
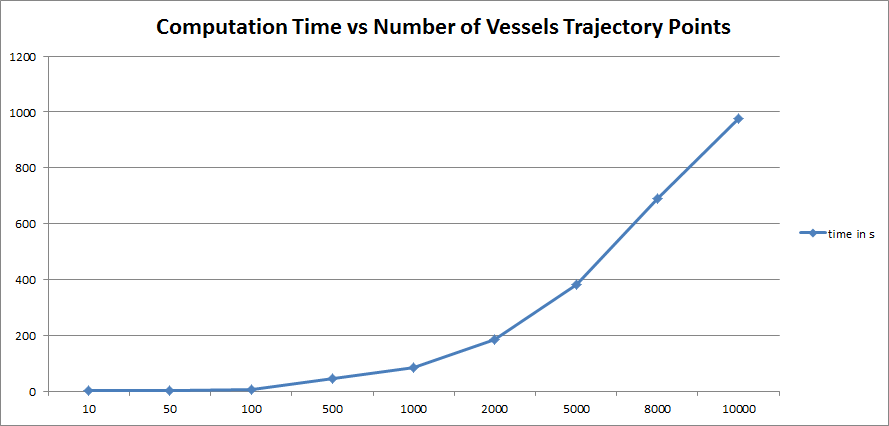
On the other side, we evaluated the computation time required by the script at the variation of the number of points to interpolate. The next figure shows the exponential nature of the computation time
Note: the script has also the possibility to be run with lower memory requirements, which takes much higher time and was not focused by this analysis.
Integration Result
We integrated the script with the D4ScienceAn e-Infrastructure operated by the D4Science.org initiative. e-InfrastructureAn operational combination of digital technologies (hardware and software), resources (data and services), communications (protocols, access rights and networks), and the people and organizational structures needed to support research efforts and collaboration in the large. facilities. This required to build an algorithm for the Statistical Manager platform. The Statistical Manager comes with a development framework to rapidly integrate R Scripts.
The added value of this framework is that it automatically accounts for multiple users requests even if the input\output of the R script is static. This is achieved by performing on-the-fly code injection.
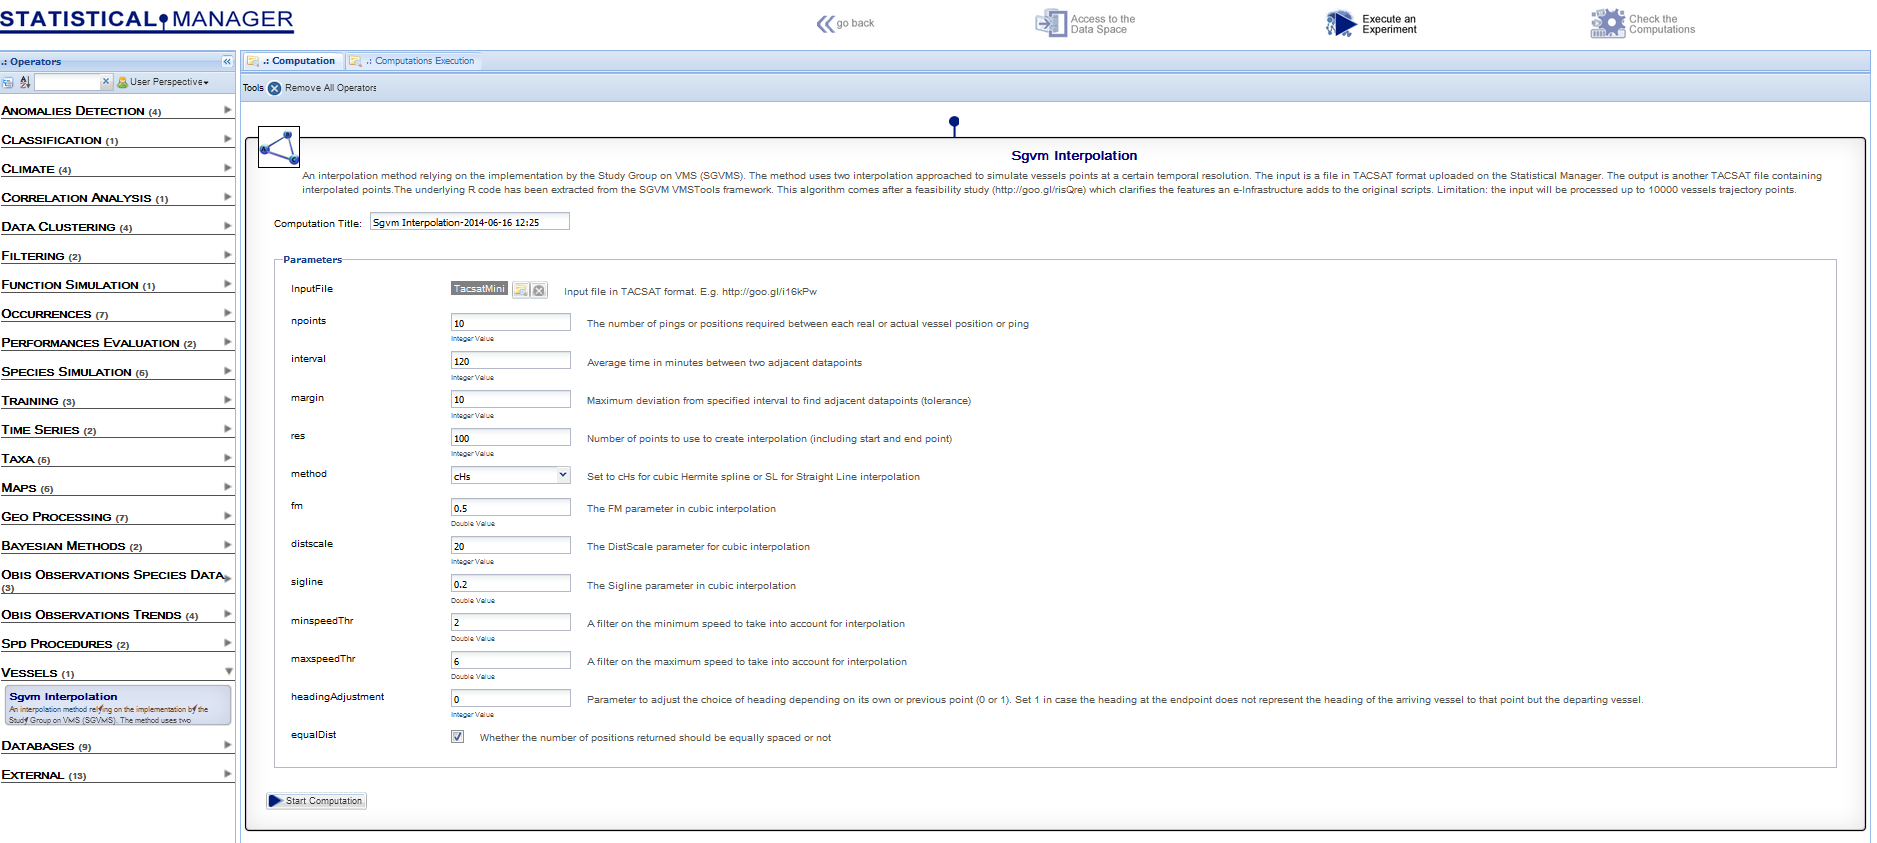
The result of such activity was that the procedure was deployed on the D4ScienceAn e-Infrastructure operated by the D4Science.org initiative. e-InfrastructureAn operational combination of digital technologies (hardware and software), resources (data and services), communications (protocols, access rights and networks), and the people and organizational structures needed to support research efforts and collaboration in the large.. This automatically endowed it with a user interface, and with facilities for data sharing and provenance maintenance.
The next figure shows the interface to the procedure automatically generated by the e-InfrastructureAn operational combination of digital technologies (hardware and software), resources (data and services), communications (protocols, access rights and networks), and the people and organizational structures needed to support research efforts and collaboration in the large., on the basis of the inputs\outputs specifications
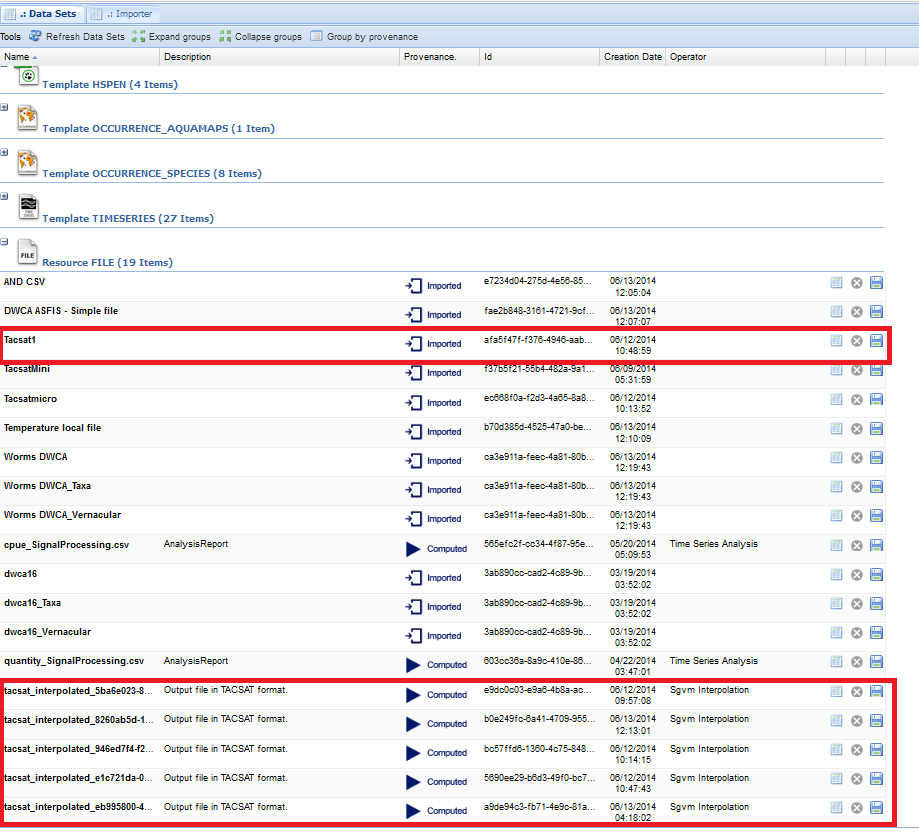
The Statistical Manager dataspace environment reports the used inputs and the produced outputs, where the distinction between them is in the metadata, which indicate if the dataset was "computed" or "imported"
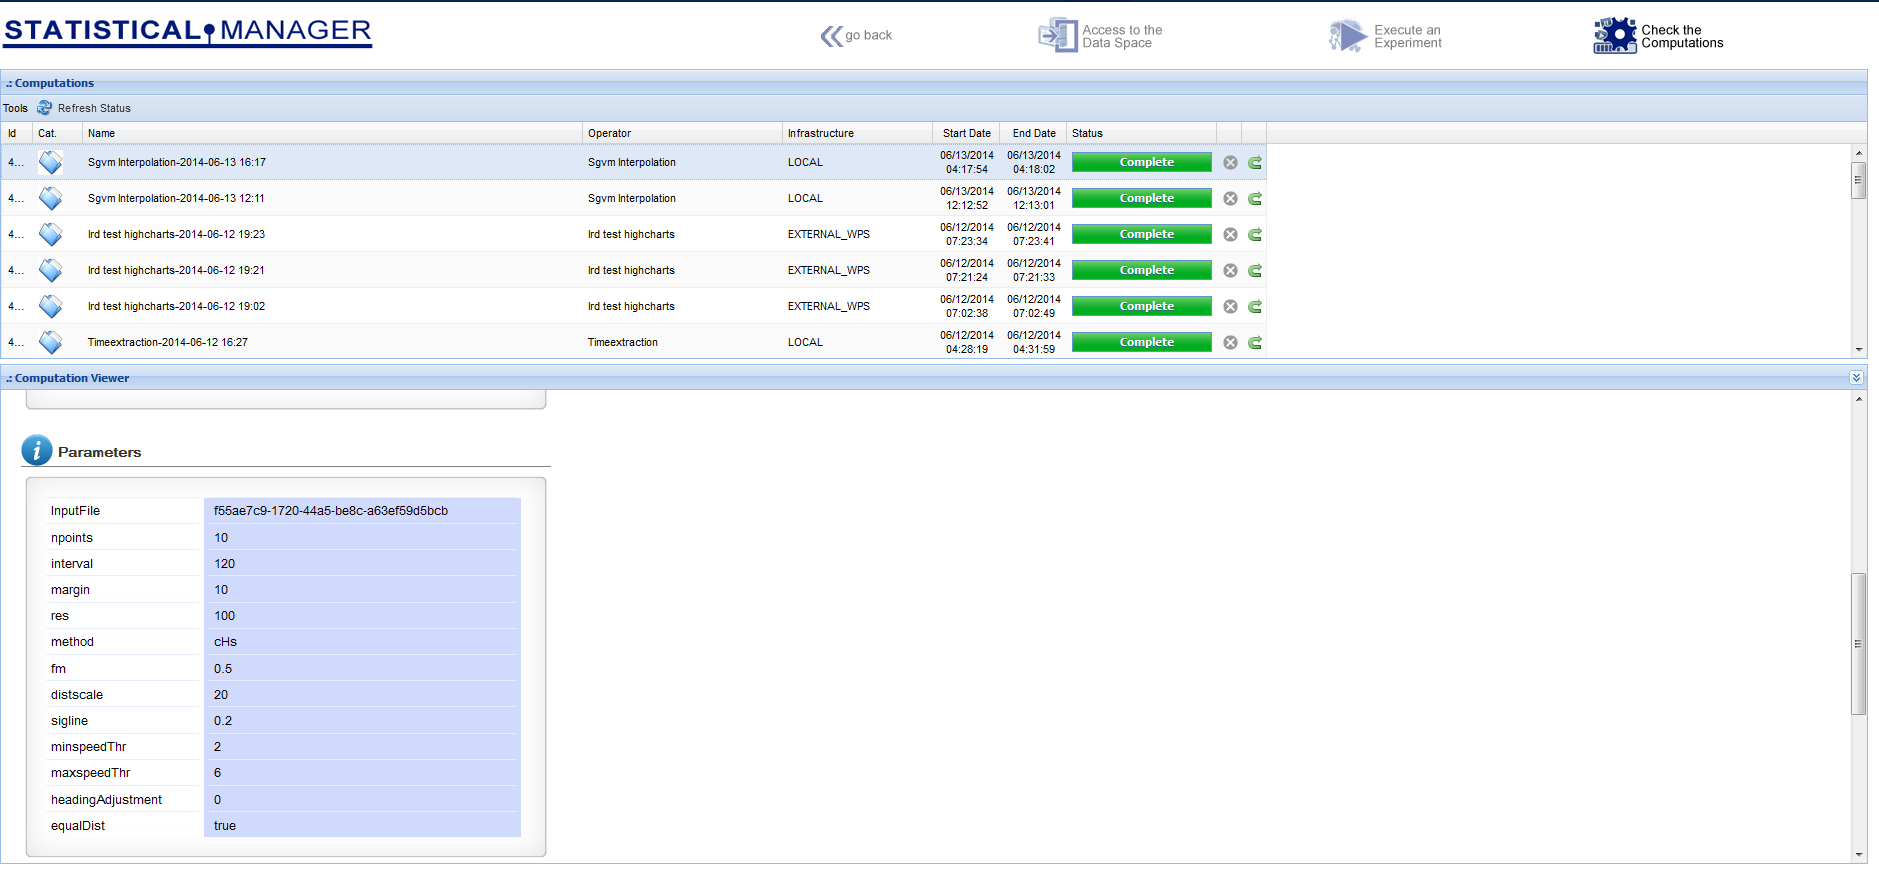
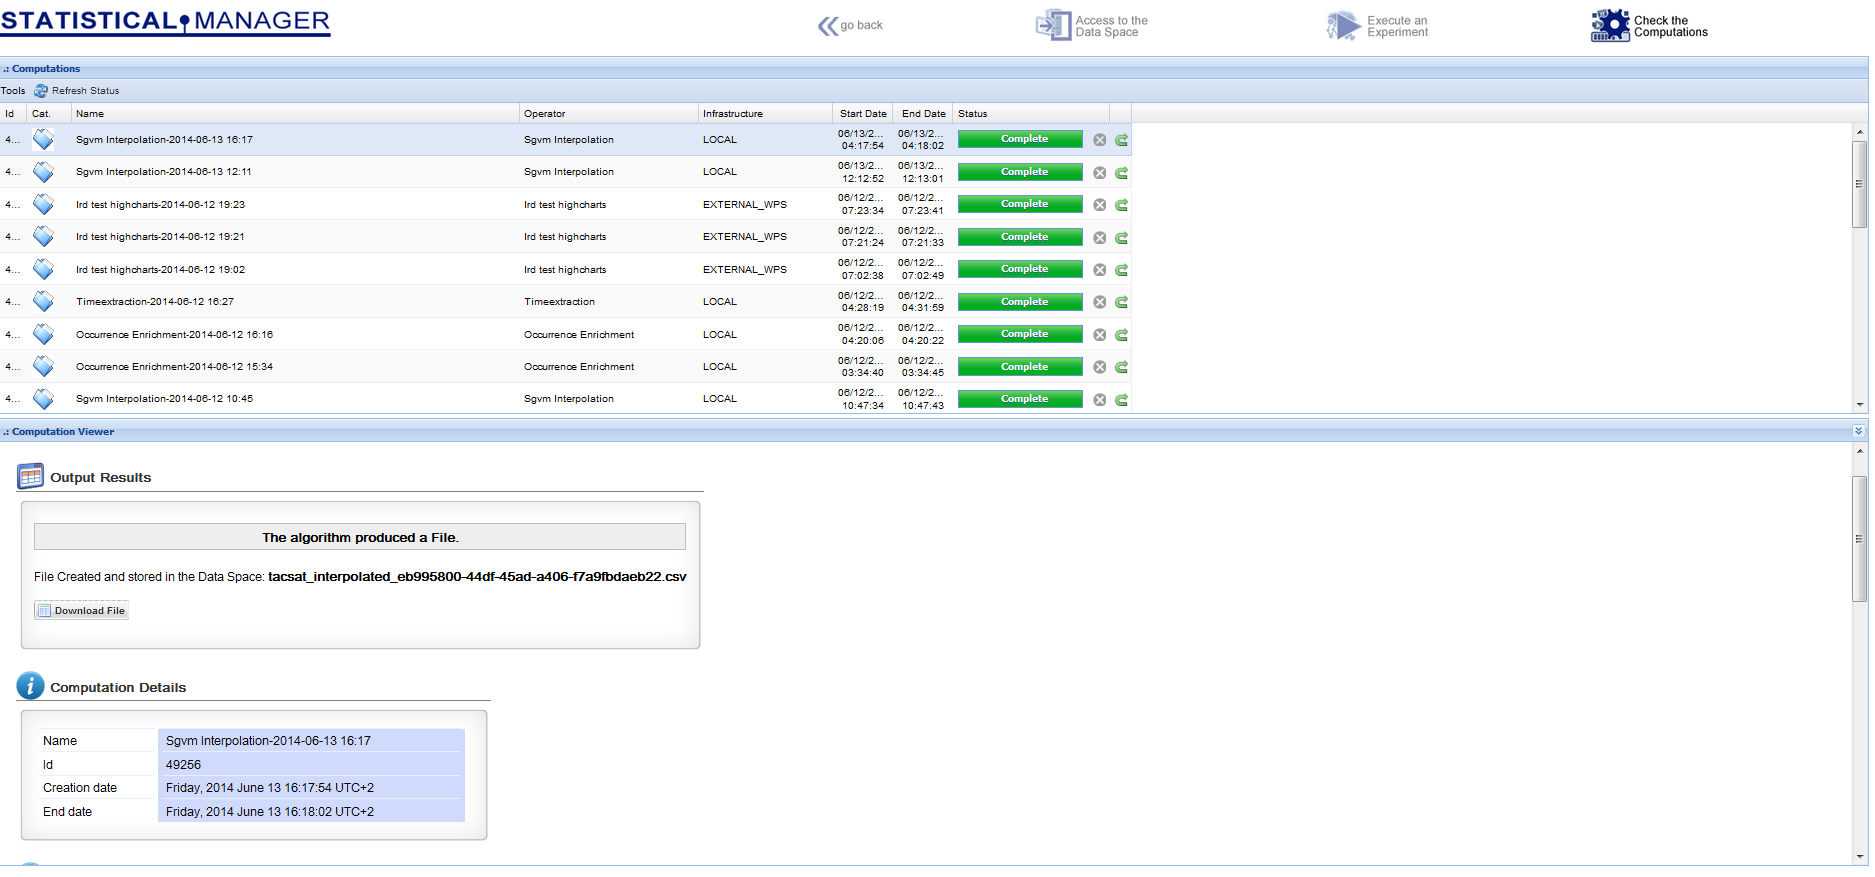
The "Check the Computations" environment allows for having the history of the experiments, along with the used parameters and the produced outputs (provenance)
Related links
A tutorial on the Statistical Manager
Implementing algorithms with the Statistical Manager Framework
Using the Statistical Manager by external thin clients
The Statistical Manager interface on the D4Science Portal (Biodiversity Lab VRE)
