Difference between revisions of "IOTC Area Predictive analysis"
(→Approach) |
(→Approach) |
||
| Line 7: | Line 7: | ||
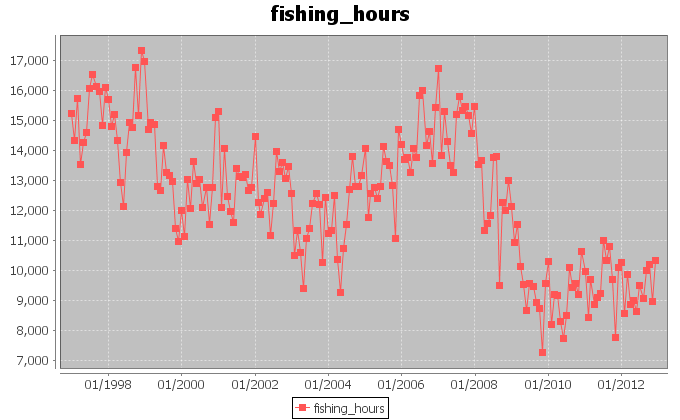
[[Image:barycentereffort.png|frame|Fishing hours aggregated per month along the entire period January 1997-December 2012]] | [[Image:barycentereffort.png|frame|Fishing hours aggregated per month along the entire period January 1997-December 2012]] | ||
Furthermore, we associated the fishing hours in one single month to the barycenter of the areas interested by the fishing activity in that month. The monthly barycenters were calculated by weighting each 1 degree cell in the original dataset according to the fishing hours spent in that month in the cell. The resulting dataset can be found here. This contains unfolded information about the barycenters coordinates and their distance from the origin of the reference system. | Furthermore, we associated the fishing hours in one single month to the barycenter of the areas interested by the fishing activity in that month. The monthly barycenters were calculated by weighting each 1 degree cell in the original dataset according to the fishing hours spent in that month in the cell. The resulting dataset can be found here. This contains unfolded information about the barycenters coordinates and their distance from the origin of the reference system. | ||
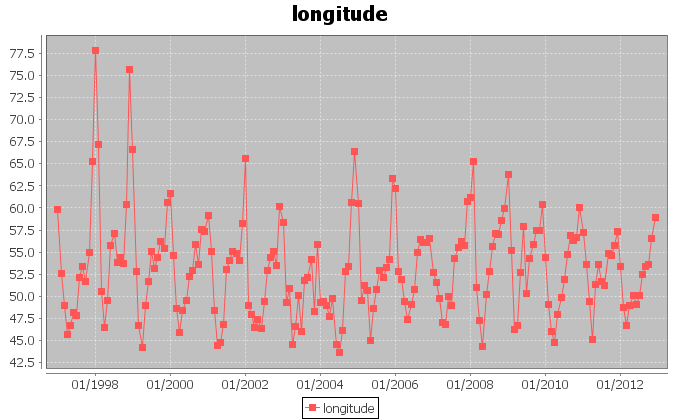
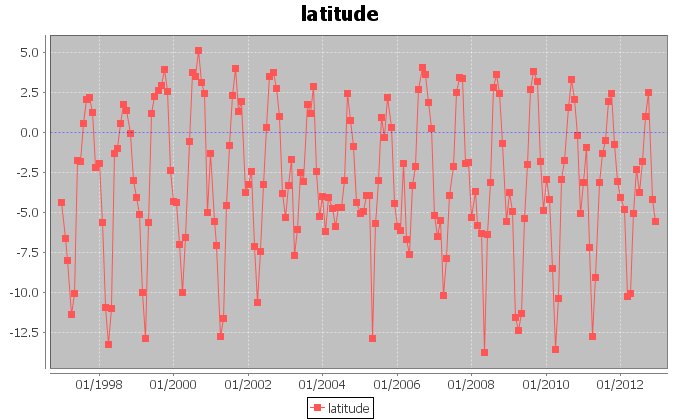
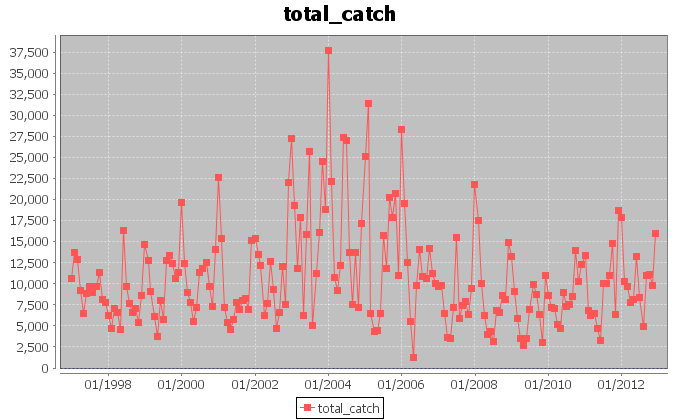
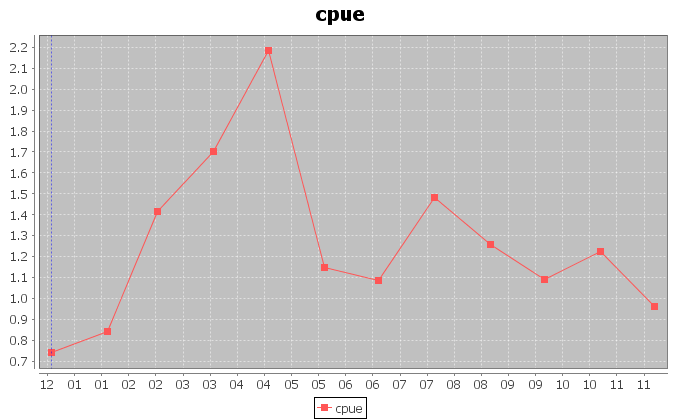
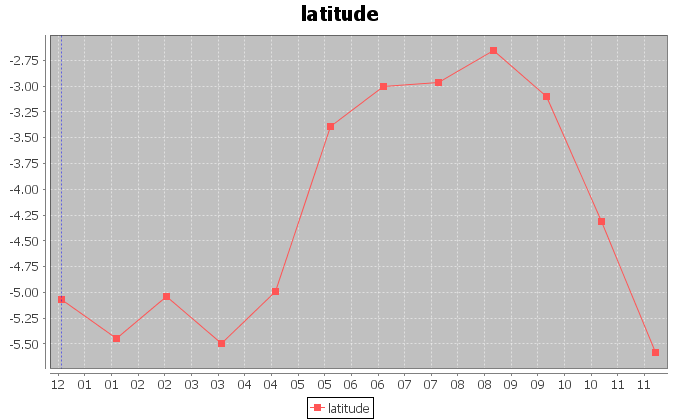
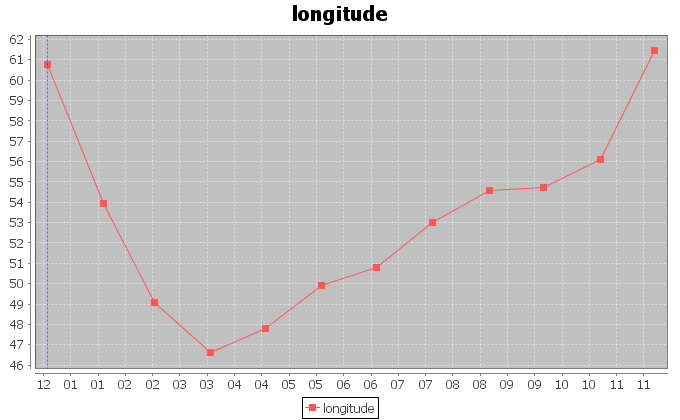
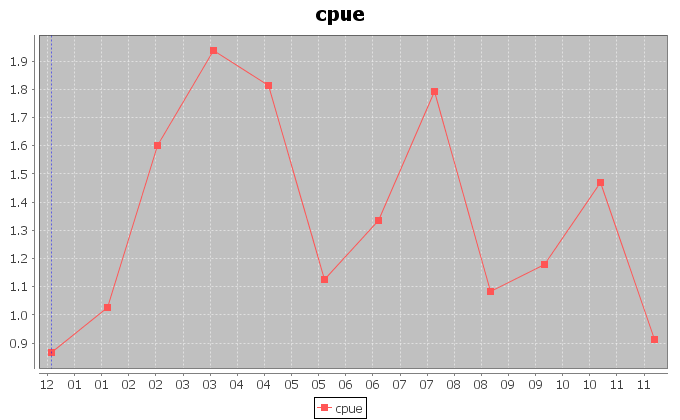
| − | Figure 2 and 3 display the trends for the longitudes and latitudes of the barycenter. The signals show a periodic behaviour, which we investigated more accurately. In figures 4 and 5 we | + | Figure 2 and 3 display the trends for the longitudes and latitudes of the barycenter. The signals show a periodic behaviour, which we investigated more accurately. In figures 4 and 5 we report the trends for the amount of catch in tonnes of the Yellowfin Tuna and the related catch per unit of effort (CPUE) calculated as the ratio between the catch and the fishing hours. |
{|style="margin: 0 auto;" | {|style="margin: 0 auto;" | ||
| Line 20: | Line 20: | ||
|} | |} | ||
| + | {|style="margin: 0 auto;" | ||
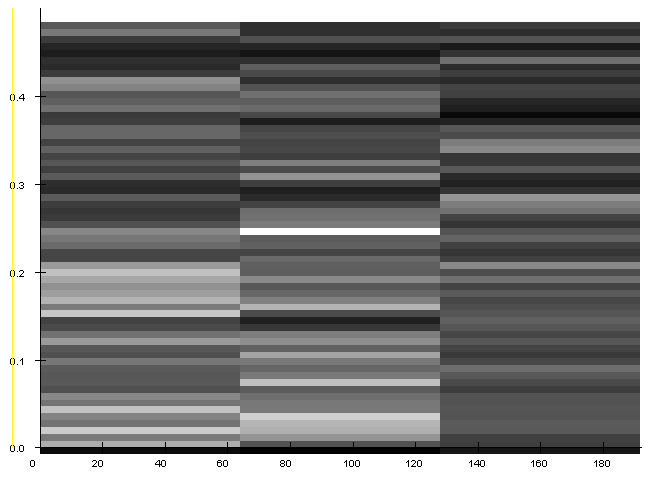
| + | | [[Image:barycenterspectrogramlongitude.png|thumb|center|upright=2.5|Spectrogram for the longitude trend.]] | ||
| + | | [[Image:barycenterspectrogramlatitude.png|thumb|center|upright=2.5|Spectrogram for the latitude trend.]] | ||
| + | |} | ||
| − | [[Image: | + | {|style="margin: 0 auto;" |
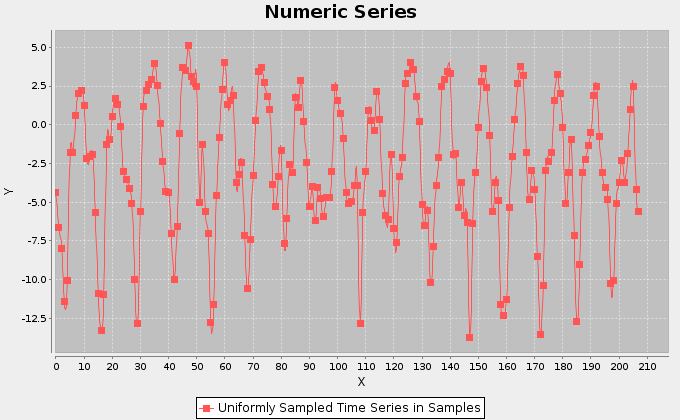
| + | | [[Image:Barycenterlongitudesamples.png|thumb|center|upright=2.5|Longitude trend in samples.]] | ||
| + | | [[Image:Barycenterlatitudesamples.png|thumb|center|upright=2.5|Latitude trend in samples.]] | ||
| + | |} | ||
| + | In order to inspect the periodic behaviour of the trends of the coordinates, we applied Fourier analysis to the signals and traced the spectrograms. In both the cases, the analysis detected a period of in the samples, which corresponds to a periodic exploitation of some areas. | ||
| + | {|style="margin: 0 auto;" | ||
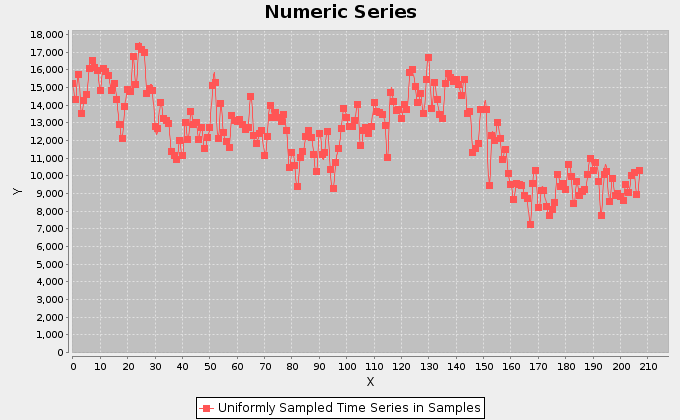
| + | | [[Image:barycentereffortsamples.png|thumb|center|upright=2.5|Fishing hours trend in samples.]] | ||
| + | | [[Image:barycenterspectrogrameffort.png|thumb|center|upright=2.5|Spectrogram for the fishing hours trend.]] | ||
| + | |} | ||
| − | |||
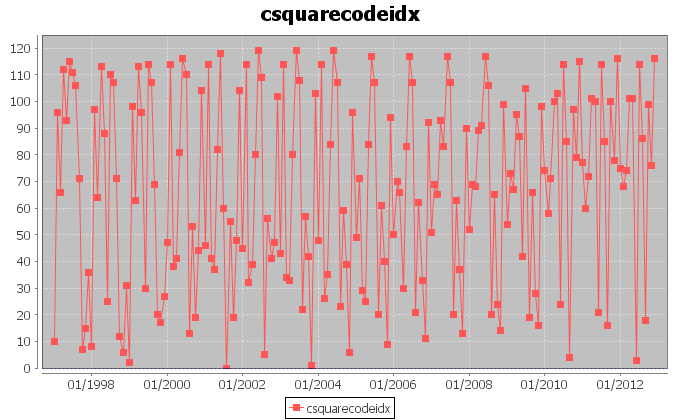
[[Image:barycentercsquares.png|frame|center|Distribution of the presence of vessels on 1 degree csquares, in the entire period January 1997-December 2012]] | [[Image:barycentercsquares.png|frame|center|Distribution of the presence of vessels on 1 degree csquares, in the entire period January 1997-December 2012]] | ||
| − | |||
| − | |||
| − | |||
| − | |||
| − | |||
| − | |||
| − | |||
| − | |||
Revision as of 14:09, 21 May 2014
Description
Hypothesis and Thesis
Approach
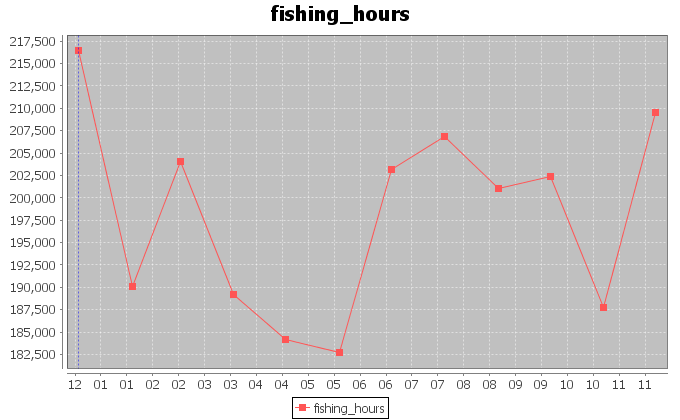
Our first attempt aimed to discover hidden periodicities in the exploitation of the ocean area. Thus, we traced the trend of the fishing hours effort in the period between January 1997 and December 2012. We summed the hours spent in the same month and eventually obtained the trend in figure 1.
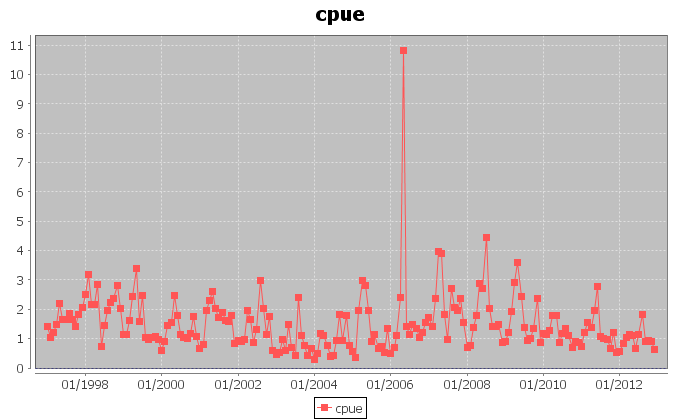
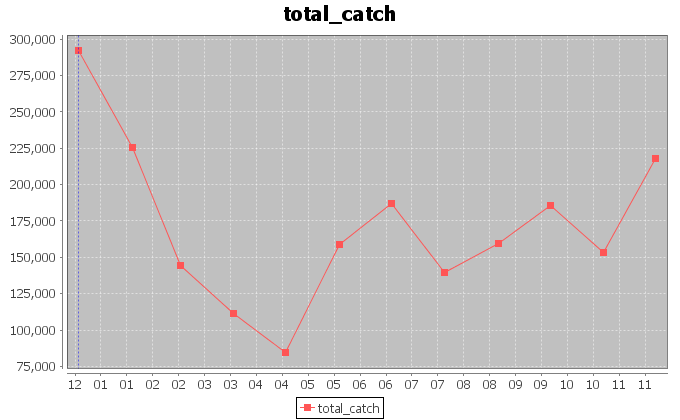
Furthermore, we associated the fishing hours in one single month to the barycenter of the areas interested by the fishing activity in that month. The monthly barycenters were calculated by weighting each 1 degree cell in the original dataset according to the fishing hours spent in that month in the cell. The resulting dataset can be found here. This contains unfolded information about the barycenters coordinates and their distance from the origin of the reference system. Figure 2 and 3 display the trends for the longitudes and latitudes of the barycenter. The signals show a periodic behaviour, which we investigated more accurately. In figures 4 and 5 we report the trends for the amount of catch in tonnes of the Yellowfin Tuna and the related catch per unit of effort (CPUE) calculated as the ratio between the catch and the fishing hours.
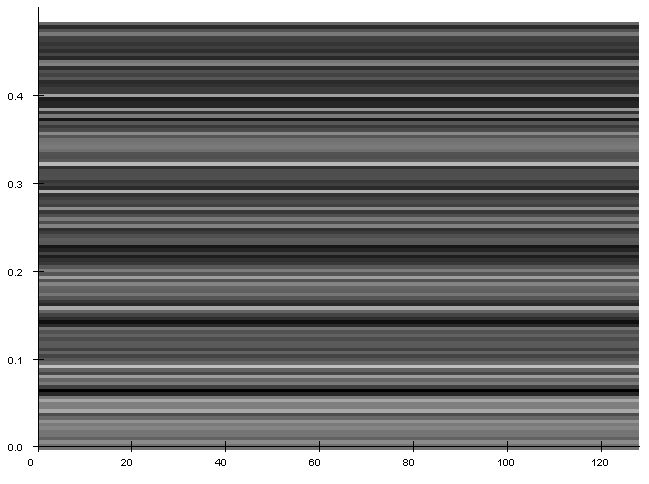
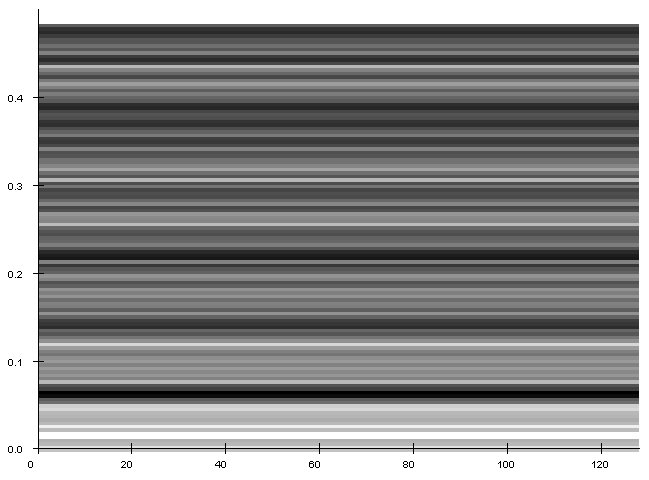
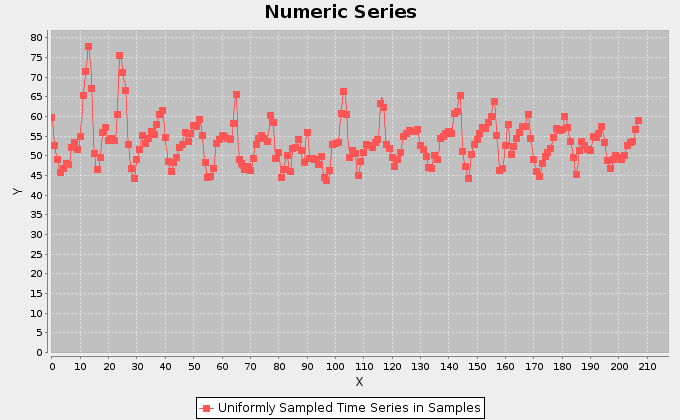
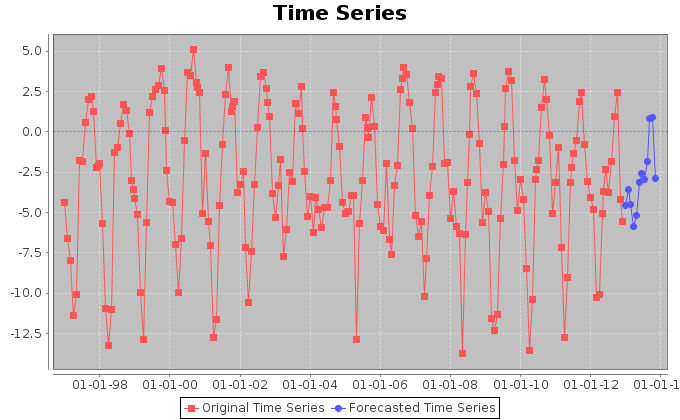
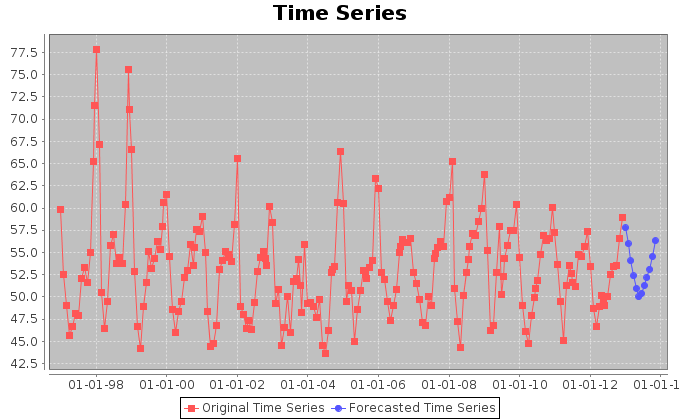
In order to inspect the periodic behaviour of the trends of the coordinates, we applied Fourier analysis to the signals and traced the spectrograms. In both the cases, the analysis detected a period of in the samples, which corresponds to a periodic exploitation of some areas.
Aggregation on 12 Months
Analysis on the Most Exploited Csquare
| Csquare code | Exploitation (fishing hours) |
|---|---|
| 3005 | 614135.3 |
| 1005 | 709254.3 |
| 3004 | 513798.8 |
| 3104 | 211621.1 |
| 3006 | 258669.6 |
| 3105 | 24718.3 |
| 1004 | 12235.1 |
| 3004 | 513798.8 |
| 3007 | 33038.7 |
