Difference between revisions of "IOTC Area Predictive analysis"
From D4Science Wiki
(→Approach) |
(→Approach) |
||
| Line 5: | Line 5: | ||
==Approach== | ==Approach== | ||
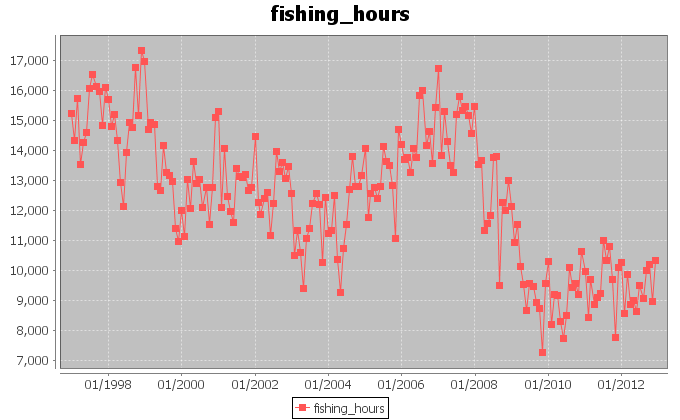
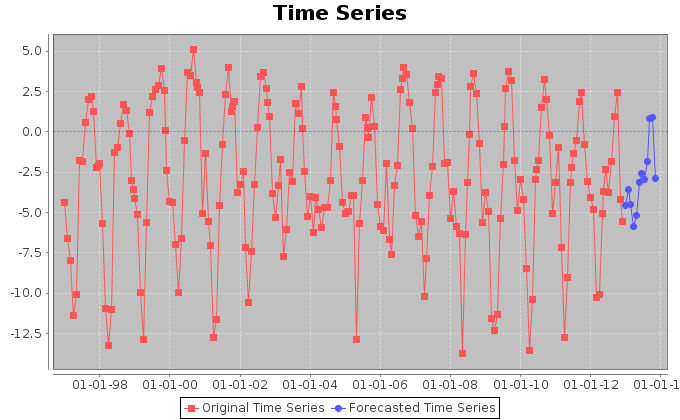
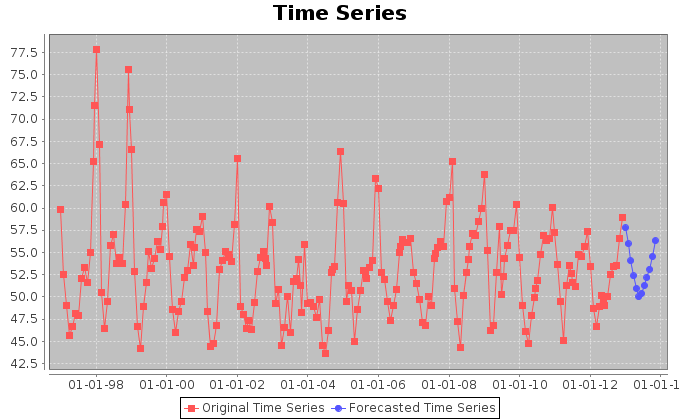
| − | [[Image:barycentereffort.png| | + | [[Image:barycentereffort.png|frame|center|Fishing hours aggregated per month along the entire period January 1997-December 2012]] |
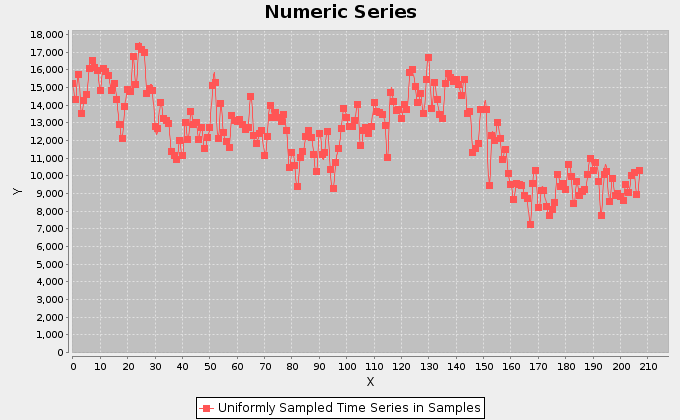
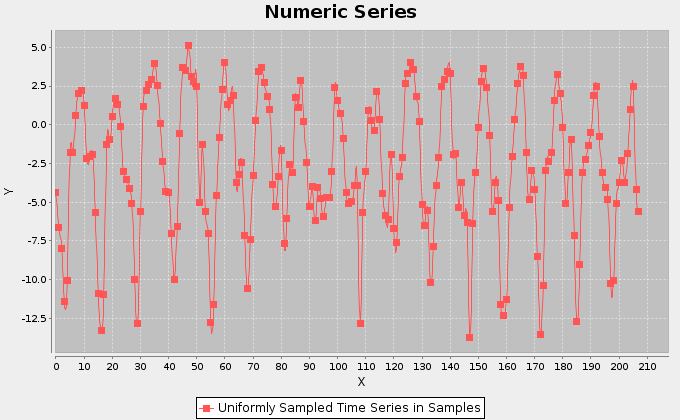
[[Image:barycentereffortsamples.png|640px|center|Fishing hours trend in samples.]] | [[Image:barycentereffortsamples.png|640px|center|Fishing hours trend in samples.]] | ||
| Line 24: | Line 24: | ||
{|style="margin: 0 auto;" | {|style="margin: 0 auto;" | ||
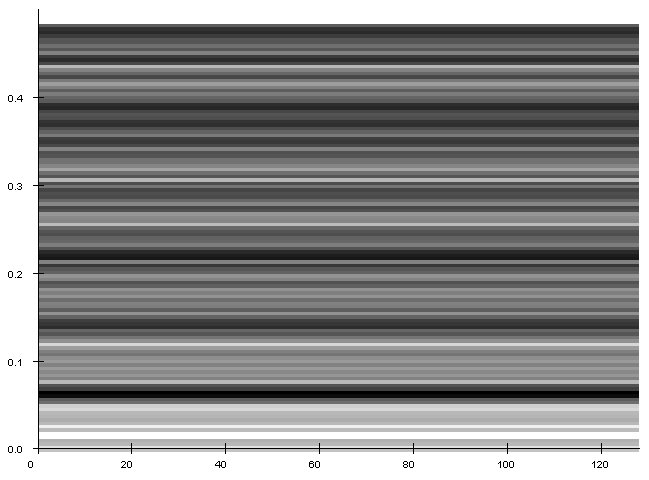
| − | | [[Image:barycenterspectrogramlatitude.png| | + | | [[Image:barycenterspectrogramlatitude.png|thumb|center|upright=2.5|Spectrogram for the latitude trend.]] |
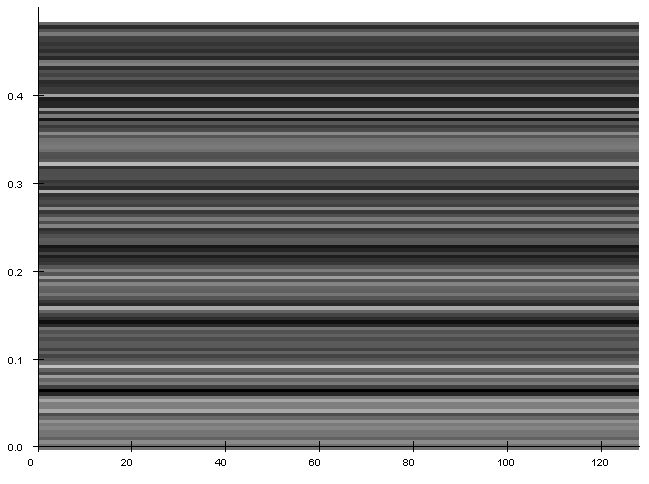
| − | | [[Image:barycenterspectrogramlongitude.png| | + | | [[Image:barycenterspectrogramlongitude.png|thumb|center|upright=2.5|Spectrogram for the longitude trend.]] |
|} | |} | ||
Revision as of 12:21, 21 May 2014
Description
Hypothesis and Thesis
Approach
Aggregation on 12 Months
Analysis on the Most Exploited Csquare
| Csquare code | Exploitation (fishing hours) |
|---|---|
| 3005 | 614135.3 |
| 1005 | 709254.3 |
| 3004 | 513798.8 |
| 3104 | 211621.1 |
| 3006 | 258669.6 |
| 3105 | 24718.3 |
| 1004 | 12235.1 |
| 3004 | 513798.8 |
| 3007 | 33038.7 |
